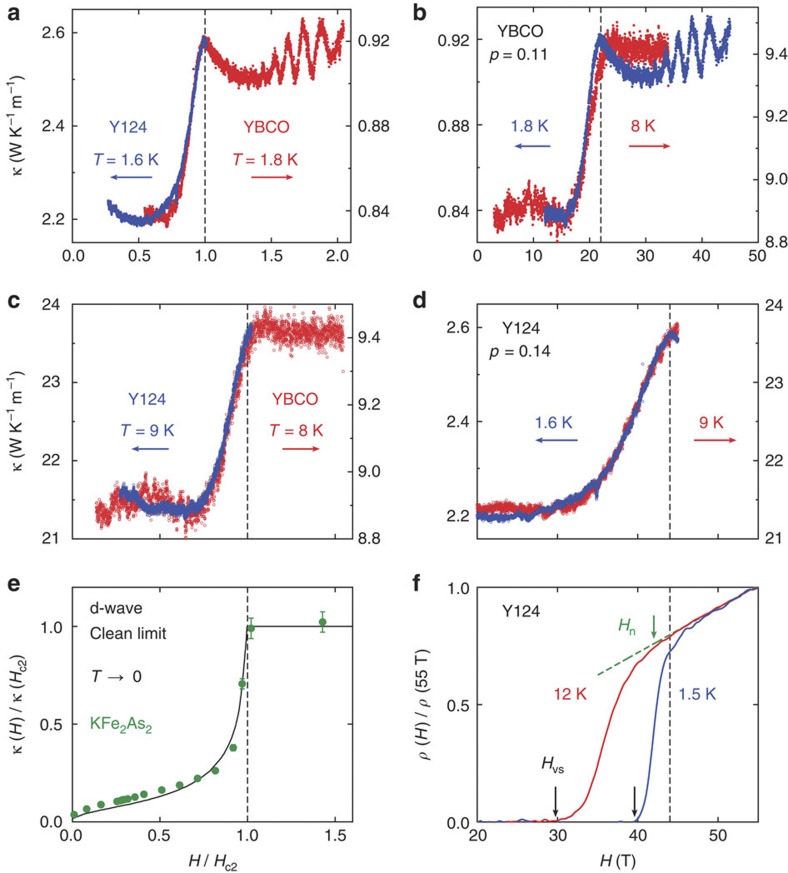
Figure 1. Thermal conductivity of YBCO and Y124.
(a–d) Magnetic field dependence of the thermal conductivity κ in YBCO (p=0.11) and Y124 (p=0.14), for temperatures as indicated. The end of the rapid rise marks the end of the vortex state, defining the upper critical field Hc2 (vertical dashed line). In Fig. 1a,c, the data are plotted as κ vs H/Hc2, with Hc2=22 T for YBCO and Hc2=44 T for Y124. The remarkable similarity of the normalized curves demonstrates the good reproducibility across dopings. The large quantum oscillations seen in the YBCO data above Hc2 confirm the long electronic mean path in this sample. In Fig. 1b,d, the overlap of the two isotherms plotted as κ vs H shows that Hc2(T) is independent of temperature in both YBCO and Y124, up to at least 8 K. (e) Thermal conductivity of the type-II superconductor KFe2As2 in the T=0 limit, for a sample in the clean limit (green circles). Error bars represent the uncertainty in extrapolating κ/T to T=0. The data9 are compared with a theoretical calculation for a d-wave superconductor in the clean limit8. (f) Electrical resistivity of Y124 at T=1.5 K (blue) and T=12 K (red) (ref. 11). The green arrow defines the field Hn below which the resistivity deviates from its normal-state behaviour (green dashed line). While Hc2(T) is essentially constant up to 10 K (Fig. 1d), Hvs(T)—the onset of the vortex-solid phase of zero resistance (black arrows)—moves down rapidly with temperature (see also Fig. 3b).

