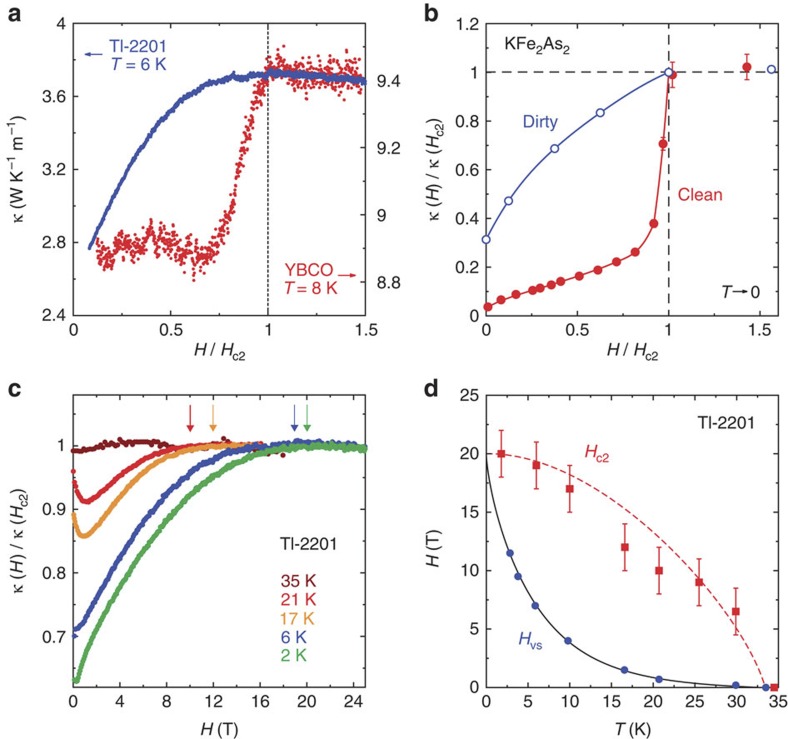
Figure 2. Thermal conductivity and H-T diagram of Tl-2201.
(a) Magnetic field dependence of the thermal conductivity κ in Tl-2201, measured at T=6 K on an overdoped sample with Tc=33 K (blue). The data are plotted as κ vs H/Hc2, with Hc2=19 T, and compared with data on YBCO at T=8 K (red; from Fig. 1b), with Hc2=23 T. (b) Corresponding data for KFe2As2, taken on clean9 (red) and dirty10 (blue) samples. (c) Isotherms of κ(H) in Tl-2201, at temperatures as indicated, where κ is normalized to unity at Hc2 (arrows). Hc2 is defined as the field below which κ starts to fall with decreasing field. (d) Temperature dependence of Hc2 (red squares) and Hvs (blue circles) in Tl-2201. Error bars on the Hc2 data represent the uncertainty in locating the onset of the drop in κ vs H relative to the constant normal-state behaviour. All lines are a guide to the eye.

