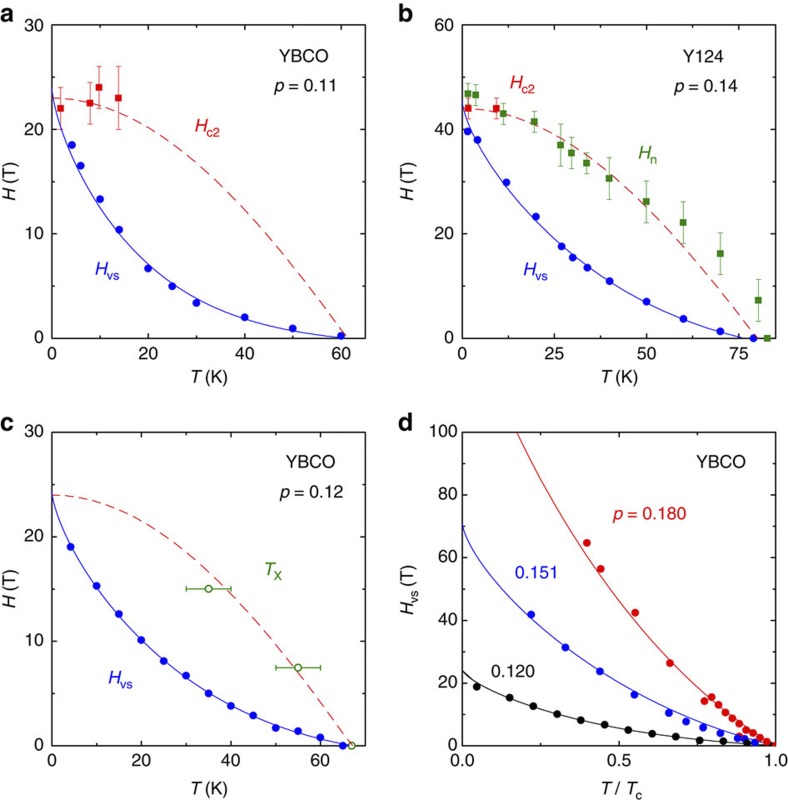
Figure 3. Field-temperature phase diagram of YBCO and Y124.
(a,b) Temperature dependence of Hc2 (red squares, from data as in Fig. 1) for YBCO and Y124, respectively. The red dashed line is a guide to the eye, showing how Hc2(T) might extrapolate to zero at Tc. Error bars on the Hc2 data represent the uncertainty in locating the onset of the downward deviation in κ vs H relative to the normal-state behaviour. The solid lines are a fit of the Hvs(T) data (solid circles) to the theory of vortex-lattice melting1, as in ref. 14. Note that Hc2(T) and Hvs(T) converge at T=0, in both materials, so that measurements of Hvs vs T can be used to determine Hc2(0). In Fig. 3b, we plot the field Hn defined in Fig. 1f (open green squares, from data in ref. 11), which corresponds roughly to the upper boundary of the vortex-liquid phase (see Supplementary Note 3). Error bars on the Hn data represent the uncertainty in locating the onset of the downward deviation in ρ vs H relative to the normal-state behaviour. We see that Hn(T) is consistent with Hc2(T). (c) Temperature TX below which charge order is suppressed by the onset of superconductivity in YBCO at p=0.12, as detected by X-ray diffraction24 (open green circles, from Supplementary Fig. 7). Error bars on the TX data represent the uncertainty in locating the onset of the downward deviation in the x-ray intensity vs T at a given field relative to the data at 17 T (see Supplementary Fig. 7a). We see that TX(H) follows a curve (red dashed line) that is consistent with Hn(T) (at p=0.14; Fig. 3b) and with the Hc2(T) detected by thermal conductivity at lower temperature (at p=0.11 and 0.14). (d) Hvs(T) vs T/Tc, showing a marked increase in Hvs(0) as p goes from 0.12 to 0.18. From these and other data (in Supplementary Fig. 6), we obtain the Hvs(T→0) values that produce the Hc2 vs p curve plotted in Fig. 4a.

