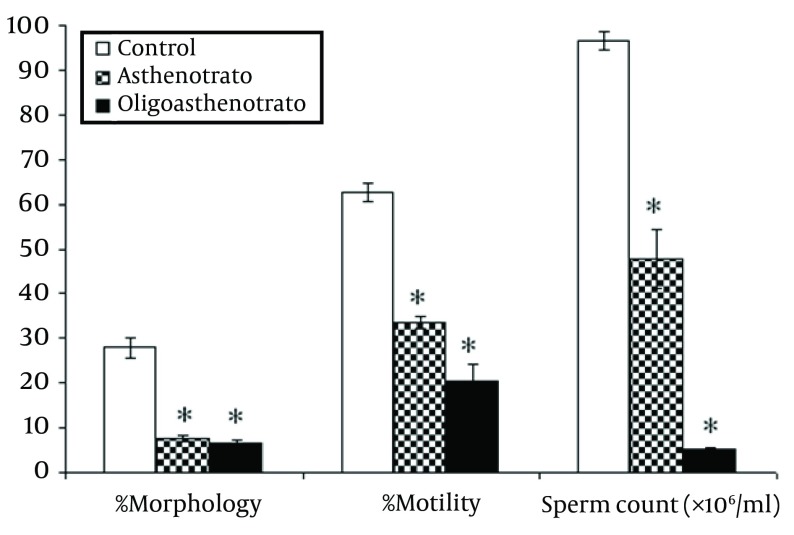
Figure 1. Comparison of Percentage of Motility, Morphology and Sperm Count (× 106/Ml) Between Control (C) and Patient Groups (AT, OAT).
Percentage of normal sperm morphology between patient groups was significant (P = 0.006). Error bar, representing SEM. P < 0.05 was considered statistically significant, * P < 0.001

