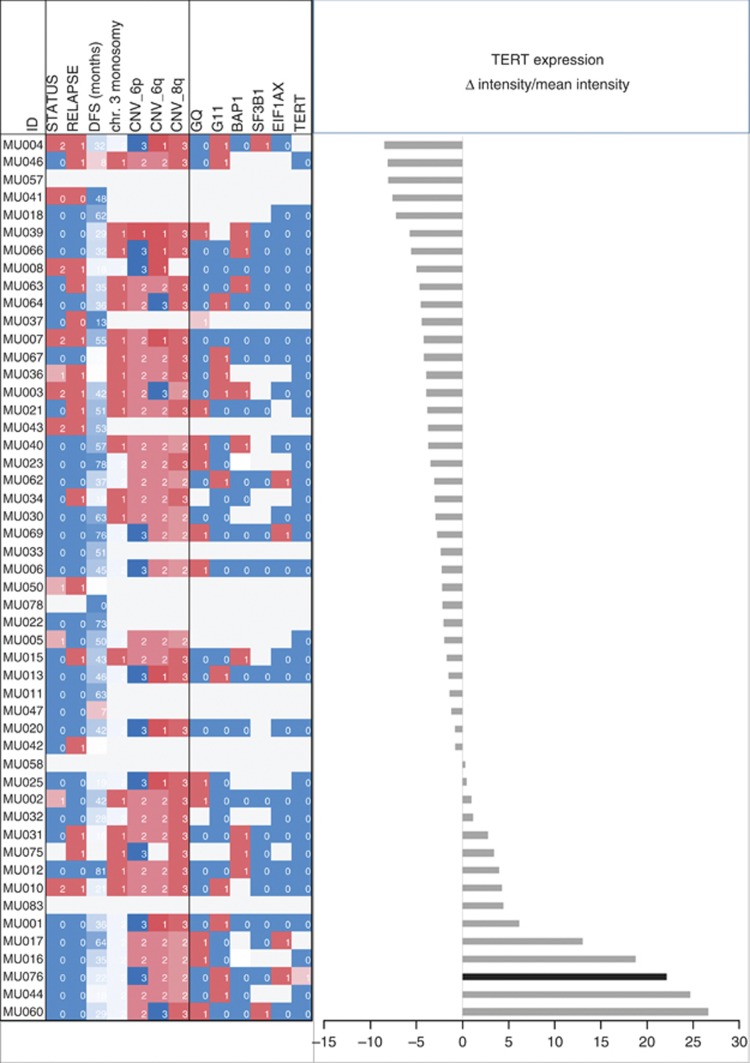
Figure 4.
TERT gene expression and tumour characteristics. The differences between microarray intensity values measured for the single cases and the mean of the whole cohort are plotted (right panel). The case carrying the TERT promoter mutation is indicated in black. Clinical, histopathological and molecular characteristics are indicated (left panel): status (0=alive, 1=death of other causes, 2=death of uveal melanoma metastasis), relapse (0=relapse free, 1=relapse), CNVs (1=monosomic or losses, 2=disomic, 3=trisomic or gains), mutations (0=wild type, 1=mutated). For details see Supplementary Table 1.

