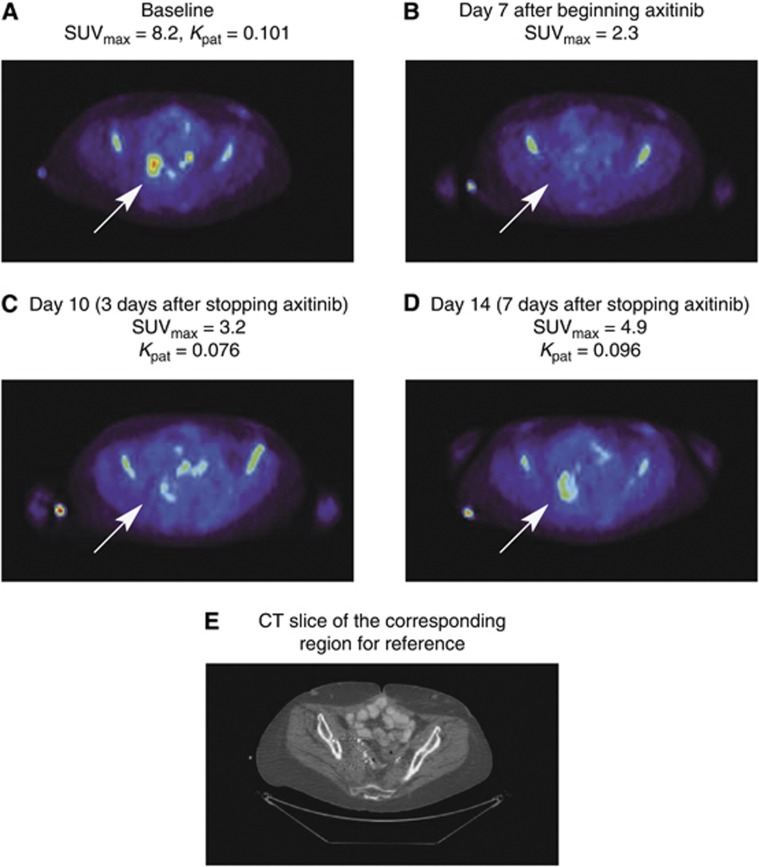
Figure 4.
Changes in 18FLT uptake during and after axitinib treatment in a 3.0 × 3.1 cm2 right ilio-sacral region mass in a sample patient. Arrows denote site of target lesion at (A) baseline; (B) day 7 axitinib dosing; (C) day 10 (3 days after stopping axitinib dose); (D) day 14 (7 days after stopping axitinib); and (E) computed tomography slide of corresponding region of reference. Abbreviations: 18FLT= [18F] fluorothymidine; Kpat=Patlak influx constant; SUVmax=maximum uptake value.

