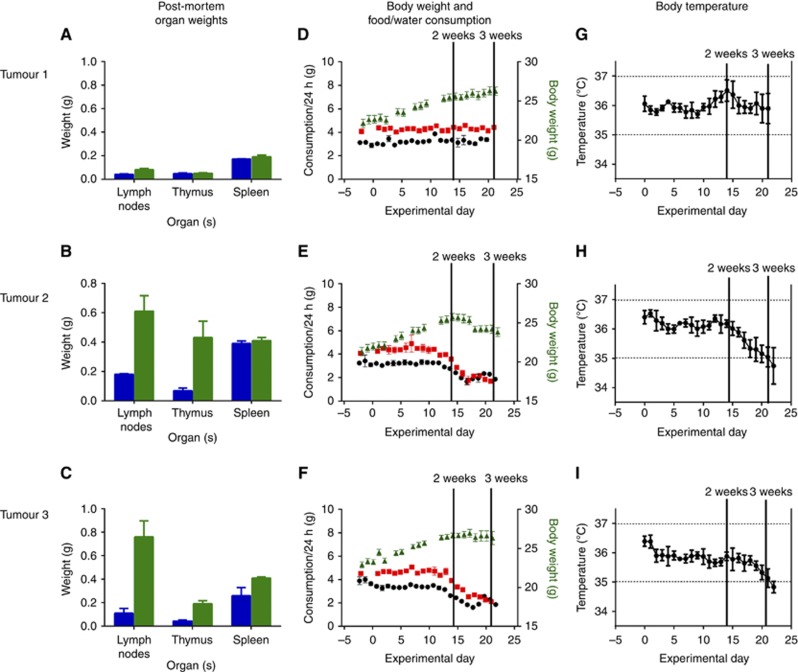
Figure 3.
Tumour burden and changes in clinical biomarkers with disease progression. (A–C) Organ weights at post-mortem classified by primary tumour implanted (mean±s.e.m.). Two week endpoints in blue, 3 week endpoints in green. (D–F) Changes in food/water consumption and body weight following tumour implantation on experimental day 0. Data plotted as mean±s.e.m. (mean body weight calculated from individual values; mean food/water consumption calculated from cage values). Body weight is in green, water consumption is in red and food consumption is in black. (G–I) Change in temperature following tumour implantation plotted as 3-day moving averages (mean+/−s.e.m.).

