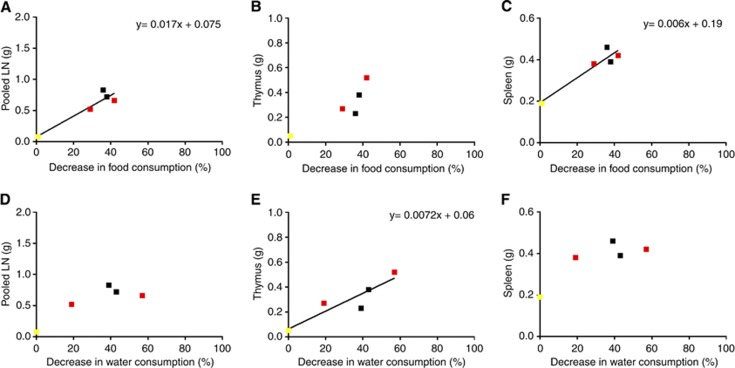
Figure 5.
Relationship between food/water consumption and mean tumour burden. Tumour 1 in yellow, tumour 2 in red and tumour 3 in black. (A–C) Scatter plots to show relationships between decrease in food consumption and total weight of lymph nodes (cervical, brachial, inguinal, mesenteric), thymus and spleen. (D–F) Scatter plots to show relationships between decrease in water consumption and total post-mortem weight of lymphoid organs.

