
Figure 4.
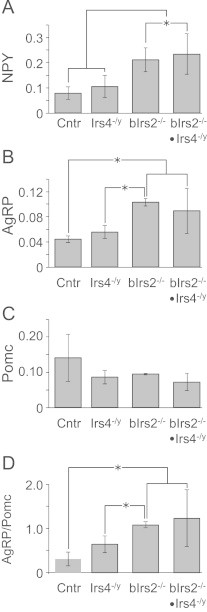
Levels of mRNA (relative to actin) by RT-PCR of Npy (A), Agrp (B) and Pomc (C) from hypothalamus of 3-month-old chow-fed male mice of the indicated genotypes. (D) Ratio between Agrp and Pomc mRNAs (from B, C) for the indicated genotypes. Data are presented as mean±SEM; * p<0.05 for indicated comparisons. (n=4–5).