
Figure 3.
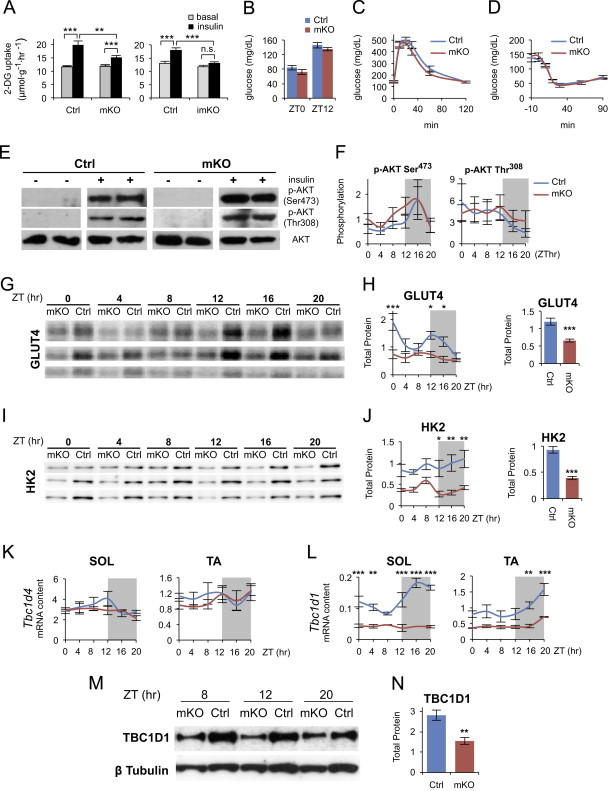
Insulin-dependent glucose uptake is impaired by muscle-specific Bmal1 deletion. (A) Insulin-stimulated [3H]-2-Deoxyglucose (2-DG) uptake by isolated SOL muscles from mKO (left panel) and imKO mice (right panel) versus respective controls (mean±SEM; n=15/group; **p<0.01, ***p<0.001, Student's t-test). (B) Fasting blood glucose levels at ZT0 (n=6/group) and ZT12 (n=10/group) from Ctrl and mKO mice (mean±SEM). (C) Glucose tolerance test performed at ZT12 in mKO mice versus control (mean±SEM; n=10/group). (D) Insulin tolerance test performed at ZT12 in mKO mice versus control (mean±SEM; n=8/group). (E) Basal (−) and insulin-induced (+) AKT Ser473 and Thr308 phosphorylation determined in isolated SOL muscles from mKO and Ctrl mice. (F) In situ diurnal AKT Ser473 phosphorylation (n=5/group/timepoint) and Thr308 phosphorylation (n=3/group/timepoint) in mKO and Ctrl gastrocnemius muscle quantified by densitometry after western blotting analysis (mean±SEM; arbitrary units; AKT Ser473 time effect F=2.88, p=0.02, 2-way ANOVA). (G) Western blots showing protein levels of GLUT4 across the day/night cycle in mKO and Ctrl gastrocnemius muscles from 36 different mice (n=3/group/timepoint). (H) Diurnal protein levels of GLUT4 quantified by densitometry after western blot analysis (mean±SEM; arbitrary units; n=5/group/timepoint; *p<0.05, ***p<0.001, 2-way ANOVA with Bonferroni correction, group effect F=32.2, p<0.0001; time effect F=4.45, p=0.002; group×time interaction F=2.64, p=0.03). Right panel shows mean 24-h GLUT4 protein levels (mean±SEM; arbitrary units; n=30/group; ***p<0.0001, Student's t-test). (I) Western blots showing protein levels of HK2 across the day/night cycle in mKO and Ctrl gastrocnemius muscles from 36 different mice (n=3/group/timepoint). (J) Diurnal protein levels of HK2 quantified by densitometry after western blot analysis (mean±SEM; arbitrary units; n=3/group/timepoint; *p<0.05, **p<0.01, 2-way ANOVA with the Bonferroni correction, group effect F=57.8, p<0.0001). Right panel shows mean 24-h HK2 protein levels (mean±SEM; arbitrary units; n=18/group; ***p<0.0001, Student's t-test). (K) and (L) Diurnal expression profiles of Tbc1d4 (K) and Tbc1d1 (L) transcripts in SOL and TA muscles from Ctrl and mKO mice detected by qPCR and plotted relative to 36B4 expression (mean±SEM; n=3/timepoint; **p<0.01, ***p<0.001, 2-way ANOVA with the Bonferroni correction). (M) Western blots showing TBC1D1 protein levels at three time points in mKO and Ctrl TA muscles. (N) Mean 24-h TBC1D1 protein levels in mKO and Ctrl TA muscles (mean±SEM; arbitrary units; n=4/group; **p<0.01, Student's t-test).