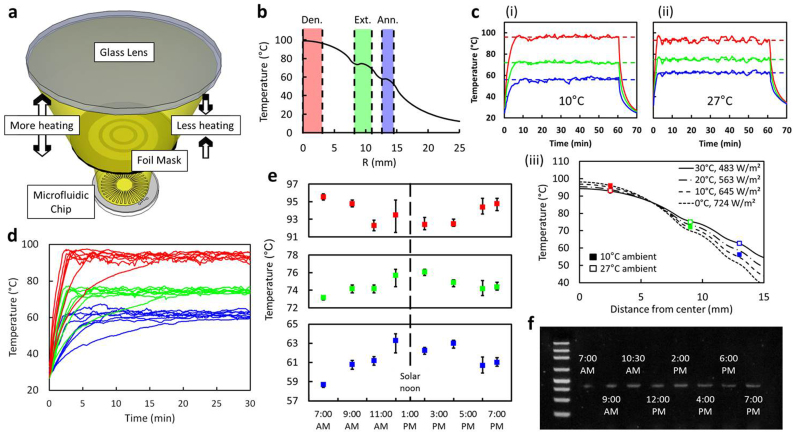
Figure 2. Thermal characterization and demonstration of solar thermal PCR.
(a), schematic showing the ability to change the solar intensity by changing the lens-to-chip distance. (b), a simulation showing the plateaued temperature profile at the plane of the microchannel. (c), measurements in (i) April and (ii) May demonstrate the ability to achieve similar on-chip temperatures using the same mask. (iii) Simulations provide thermal profiles from 0°C to 30°C ambient temperature. (d), Thermal measurements from 7 AM to 7 PM show relatively consistent values. (e), averaged temperature data shows day-long trend. f, PCR tests show that hourly changes in ambient temperature still allowed for product amplification. For Fig. 2c, d, and e, the red, green, and blue color curves respectively refer to the denaturation, extension, and annealing temperatures measured in the app.

