Figure 3.

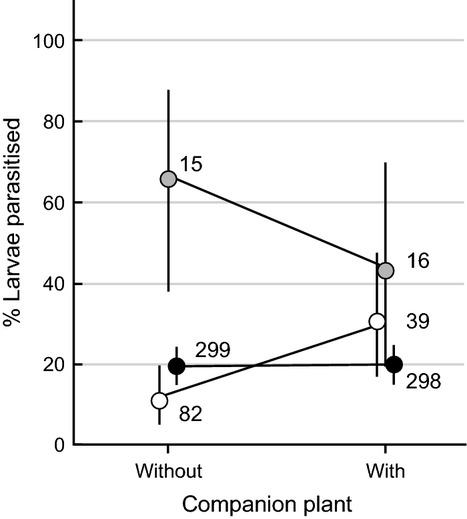
Mean parasitism rates of larvae of Mamestra brassicae (white circles), Pieris rapae (gray), and Plutella xylostella (black) in plots with or without companion plants as indicated by the presence of DNA from their main parasitoids species. Numbers indicate the numbers of larvae analyzed. Error bars indicate 95% confidence intervals for the binomial distribution.
