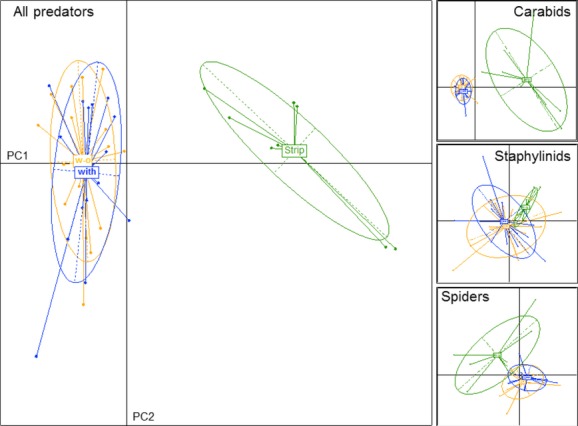
Figure 5.

Principal components (PC) analysis score plots with PC1 and PC2 for all predators combined (left), and for carabids, staphylinids, and spiders alone, color coded by habitat manipulation treatment (green, wildflower strip; blue, with companion plants; orange, without companion plants [“w–o”]). Each dot (= pair of traps) is connected to the centroid of an ellipse circumscribing the region containing 95% of the variance per treatment. PC1 and PC2 explain 13.3 and 7.6% of the variance in the combined data, respectively, 32.5 and 12.2% in carabids, 10.7 and 9.9% in staphylinids, and 14.3 and 10.8% in spiders.
