
Figure 3.
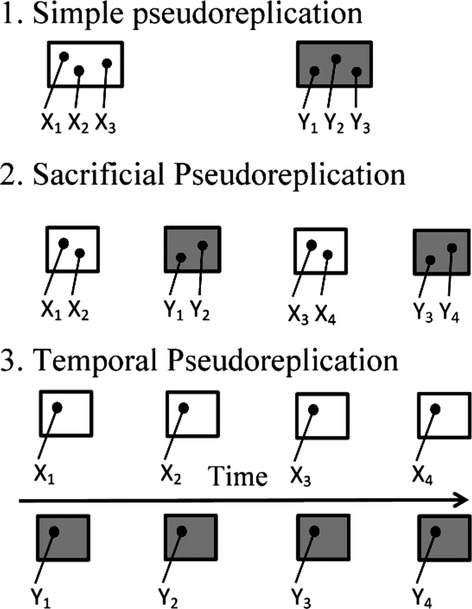
The figure (after Hurlbert 18) represents the three most common types of pseudoreplication. Shaded and unshaded boxes represent experimental units which receive different treatments. Each dot represents a sample or measurement. Pseudoreplication is a consequence (in each example) of statistical testing for a treatment effect by means of procedures which assume that the four data for each treatment have appeared from four independent experimental units. Important remark: example A cannot be analyzed properly, while B can, by taking the means for each unit.