
Figure 4.
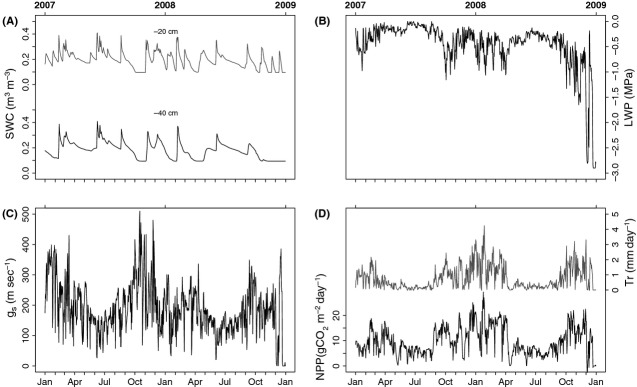
Soil water content at 20 and 40 cm depth, leaf water potential, daily average stomatal conductance, and NPP and transpiration rates for the +5°C temperature simulation. A comparison of Figure 3 with Figure 4 reveals only minor differences in forest function, for example, slightly larger maximum rates of stomatal conductance in Figure 4.