
Figure 8.
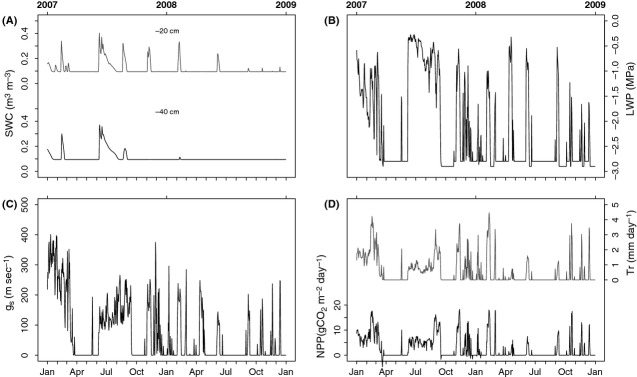
Soil water content at 20 and 40 cm depth, leaf water potential, daily average stomatal conductance, and NPP and transpiration rates for the +2.5°C plus 5 kPa increase in D simulation. A comparison of Figure 7 with Figure 8 reveals that the addition of a larger increase in T to the +2.5 kPa D resulted in reductions in stomatal conductance, leaf water potential, transpiration, and NPP.