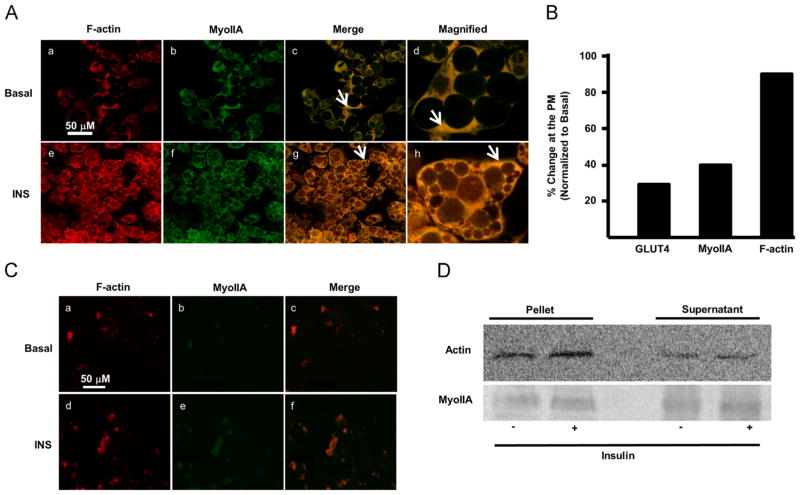
Fig. 1.
MyoIIA and F-actin colocalize at the plasma membrane in response to insulin. Day 7 3T3-L1 adipocytes were serum starved for 4 h and then either left untreated (basal) or treated with 100 nM insulin for 15 min. (A) Confocal microscopy was employed to determine the localization of MyoIIA and F-actin as described in Materials and methods. White arrows indicate either cytoplasmic or plasma membrane localization. (B) Distribution of GLUT4, MyoIIA, and F-actin in the cytoplasm and at the cell cortex under basal and insulin conditions were quantified as described in Material and methods. Briefly, ratios of fluorescence intensity comparing the levels of protein present in the cytoplasm to the cell cortex were determined, and then a percent difference of basal to insulin was calculated. Images are representative of 3 independent experiments. (C) Plasma lawns were prepared and MyoIIA and F-actin were visualized by confocal microscopy as described in Material and methods. (D) Adipocytes were fractionated as described in Materials and methods and pellet and supernatant proteins were subjected to SDS-PAGE, transferred and immunoblotted for actin. Images are representative of 3 independent experiments.

