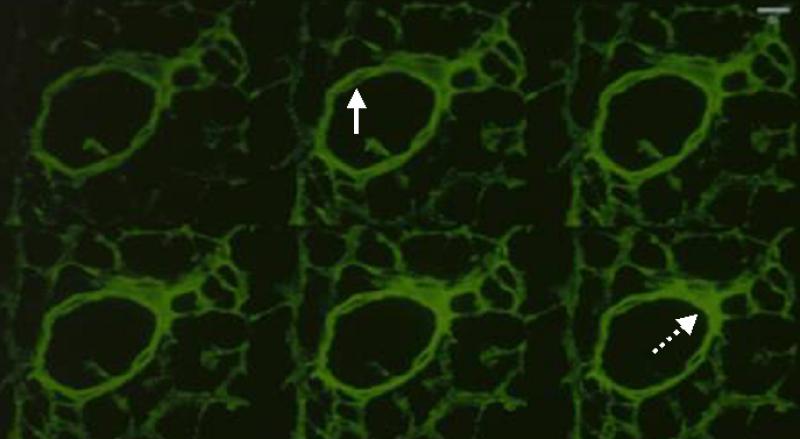
Figure 1.
Sections of horizontally imaged pericapillary fibrin deposition using laser scanning a confocal microscope from a representative blood vessel. The sequence is from left to right and represents sections 1, 3, 5, 7, 9, 11 respectively. The intensity of fibrin deposition varies according to the plane as determined by confocal microscopy. The solid and dashed arrows point to areas of low or high fibrin intensity, respectively.

