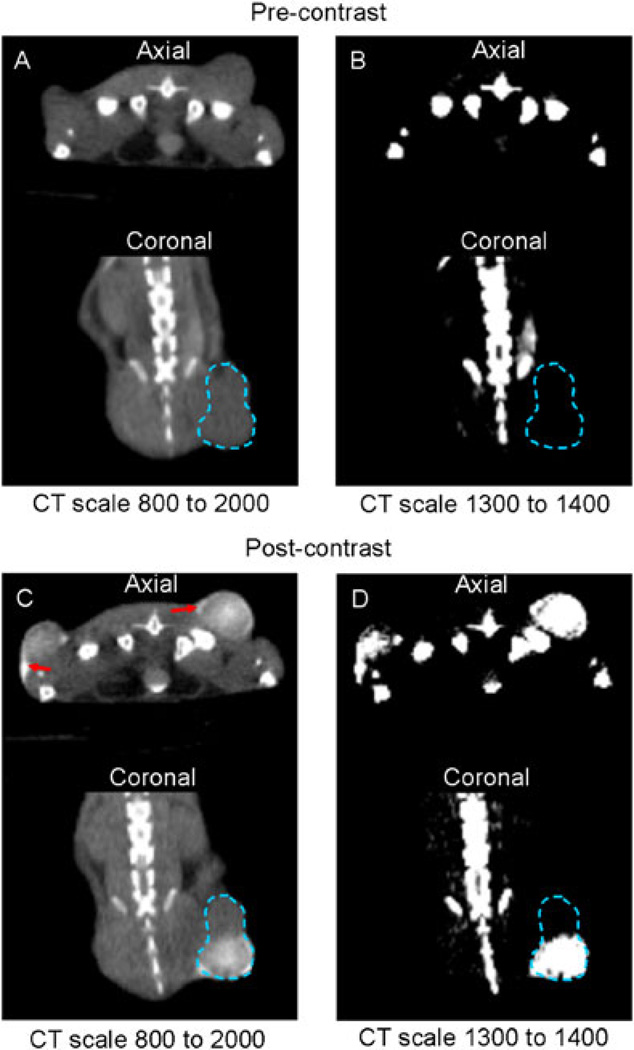
Figure 4.
Representative CT Images. Axial and coronal CT images before and after injection of MV-NIS and Omnipaque. (A, B) Precontrast tumor with a standard CT scale (A) and thresholded to exclude background soft tissue (voxel counts < 1300 CT counts) (B). (C, D) The same tumor imaged 1 min after injection is shown with the same CT scales as in (A) and (B). Red arrows show regions of extratumoral contrast agent pooling.

