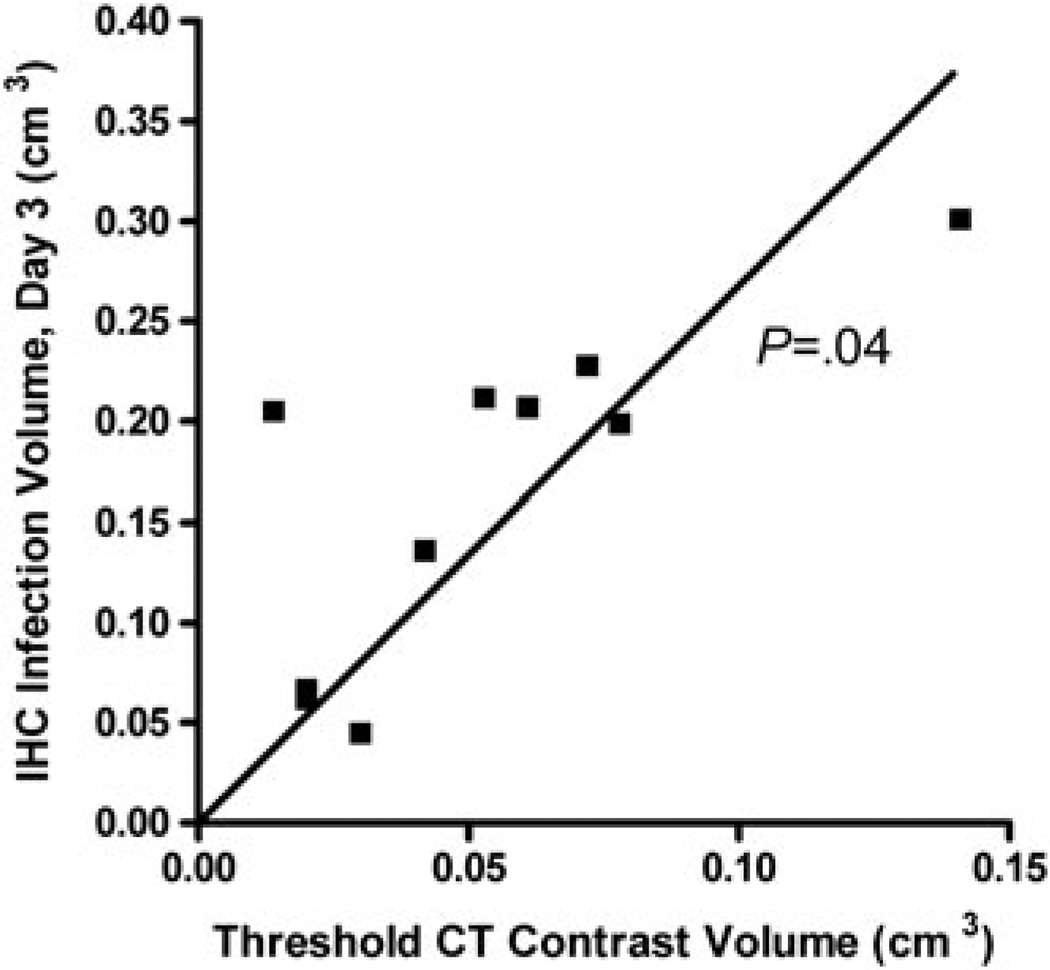
Figure 5.
Correlation between threshold contrast volume and infected tumor volume. Correlation analysis between threshold (> 1300 PMOD CT units) intratumoral contrast volume immediately after injection and infected tumor volume on day 3 post injection, as determined by IHC. The slope of the linear regression line was 2.7 IHC volume/CT contrast volume. Spearman correlation analysis yielded (p = 0.04).

