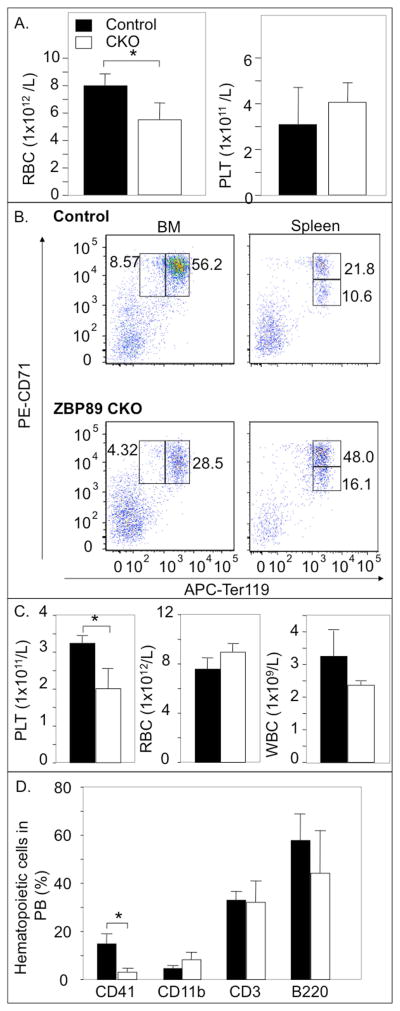
Figure 3. Effect of ZBP-89 CKO on stress erythropoiesis and thrombopoiesis.
(A) Histograms (mean ± SD, n=4) showing the effect of PHZ-induced hemolysis on RBC and platelet (PLT) counts in PB of ZBP-89 CKO mice (white bars here and in C, D) compared to control mice (black bars here and in C, D). (B) Representative FACS analyses of BM proerythroblasts (CD71highTer119low) and basophilic erythroblasts (CD71highTer119high) (left) and in basophilic- and in polychromatic (CD71lowTer119high) erythroblasts in spleen (right) of control and ZBP-89 CKO mice, two weeks after the last pIpC injection and 5 days after PHZ. Numbers for each box reflect percentages of the gated cells, with each representing the mean value from four mice in each group. (C, D) Histograms (mean ± SD, n=4) showing the effect of 5-fluorouracil (5-FU)-induced platelet depletion on circulating platelet-, white blood cells (WBC)- and RBC counts (C), and on surface phenotype, analyzed by FACS from ZBP-89 CKO and control mice, two weeks after the last pIpC treatment and 6 days after 5-FU (D). * P<0.05.

