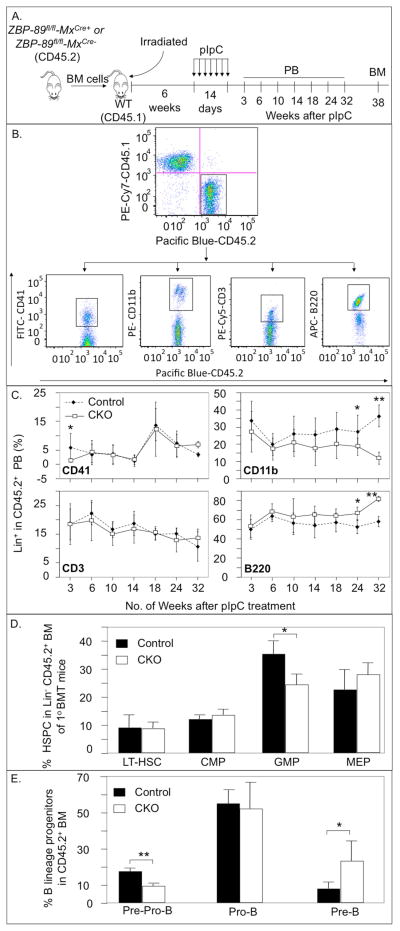
Figure 4.
PB cell counts and percentage of immature hematopoietic lineages in 1° BM transplant recipients. (A) Schematic of the experimental design: BM cells (CD45.2+) from ZBP-89 CKO and control mice were mixed with wild type (WT, CD45.1+) BM cells at a 1:1 ratio and the mixture injected into irradiated wild-type (WT) recipients (CD45.1+). pIpC injections started 6 weeks later and over a 2-week period. PB samples were analyzed at 3–32 weeks after the last pIpC dose and BM was examined at 38 weeks. (B) Isolation of lineage-specific CD45.2+CD45.1− PB cells from control recipients of 1° BM at 3 weeks post pIpC. (C) Percentage of PB megakaryocytes (CD41+), myeloid- (CD11b+), T- (CD3+) and B (B220+)-cells in the CD45.2+ population of ZBP-89−/− and control (ZBP-89fl/fl) mice at the indicated times after pIpC injections. (D) Histograms showing percentage of the different immature hematopoietic lineages in the CD45.2+ BM population of ZBP-89−/− (mean ± SD, n=7) and control mice (mean ± SD, n=8) 38 weeks after pIpC treatment. (E) Histograms (mean ± SD, n=4) showing the percentage of Pre-Pro-B cells, Pro-B cells and Pre-B cells in the CD45.2+ BM population of ZBP-89−/− and control mice 38 weeks after pIpC treatment. * P<0.05, **P<0.01.

