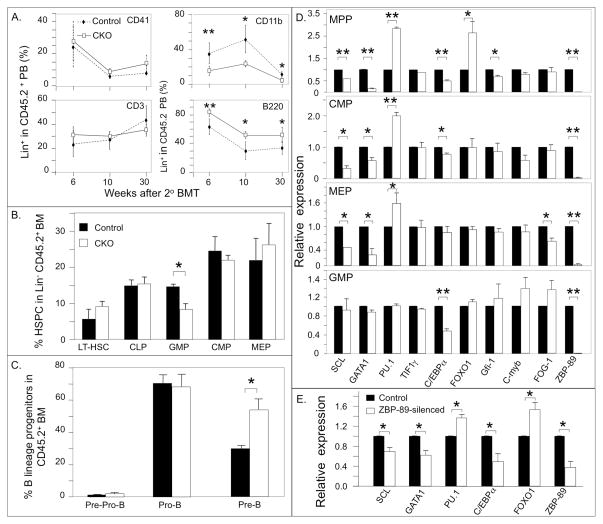
Figure 5. Hematopoietic lineages and their transcriptional profiles in 2° BM transplant recipients and in ZBP-89-silenced A4 cells.
(A) Percentages of the different HSPC lineages in CD45.2+ PB at different times after 2° BM transplantation. Results given are mean ± SD (n=5 mice in each group). (B, C) Histograms (mean ± SD, n=4) showing the percentages of the different BM progenitors in CD45.2+ BM from 2nd BMT recipients at 30 weeks post transplantation from control (black bars) and CKO mice (white bars). * P<0.05, ** P<0.01. (D) Histograms (mean ± SD, n=2 independent experiments) showing gene expression profiles in BM progenitors from ZBP-89-deficient cells 36 weeks after 2° BMT (white bars) relative to that in control mice (black bars). For each experiment, RNAs from two mice in each group were pooled for RT-PCR. * P<0.05; ** P<0.01. (E) Histograms (mean ± SD, n=2 experiments) showing gene expression profiles in control and ZBP-89-silenced A4 progenitors. * P<0.05.

