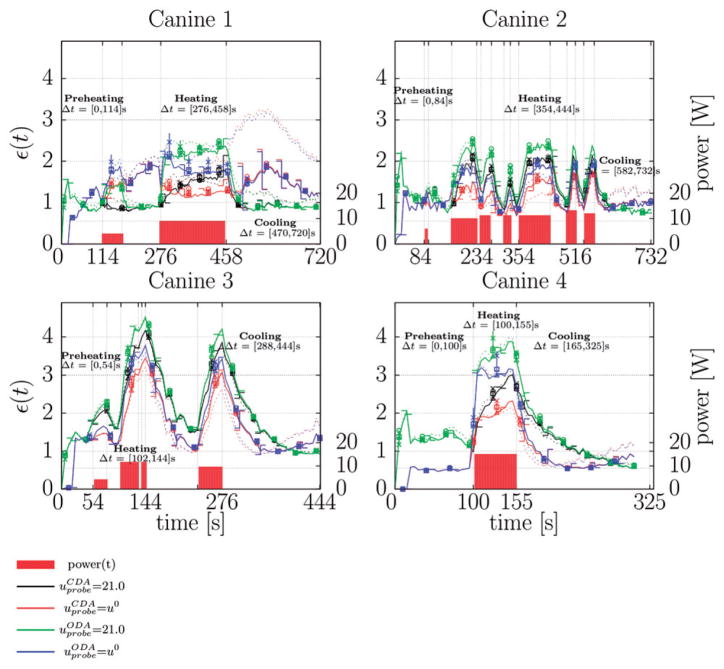
Figure 2.
Normalised error history. The history of the L2 error normalised by the measured multiplanar temperature image noise (4), ε(t), is shown for each canine in this study. The normalised error is dimensionless. Data is plotted at . The error bars shown provide the error range for the perfusion values considered; error bars left and right of the vertical axis plot ω = 3:0, , respectively. Dotted lines plot ω = 0.0 for comparison. Permutations of laser (CDA, ODA) and cooling model uprobe = (21°C, u0) are shown for each canine. The power history of the thermal dose deliver is plotted against the right axis as a reference. Power is provided in W. The labelled time intervals highlight three regimes of interest: prior to heating, during heating, and during cooling. The corresponding pointwise maximum error plots during each of the regimes is provided for the centre plane of the multiplanar data in Figures 3–4. The -×-□- ○-Δ sequence shown illustrates the convergence of the finite element numerical solution throughout the thermal dose history. The -×-□- ○-Δ plots values of the error metric (4) at when monotonically increasing the mesh resolution (decreasing element diameter from 2 mm to 0.5 mm).

