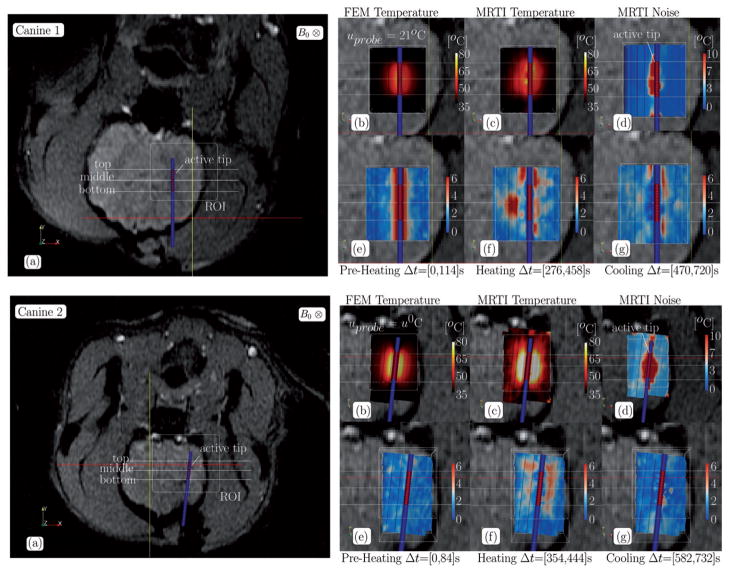
Figure 3.
Canine 1–2 data summary, CDA, (a) The anatomical position of the ROI and the spatial profiles used in Figure 5 are illustrated on magnitude images of the anatomy. Cutplanes through the ROI of the finite element data used in Figure 2 is shown in (b–g). Cutplanes are coplanar with the applicator. The pointwise maximum over time for the (b) FEM predicted temperature, (c) MR temperature data, and (d) MR temperature noise is provided in °C. The pointwise maximum normalised error (5) over time for the (e) pre-heating, (f) heating, and (g) cooling regimes labelled in Figure 2 are provided.

