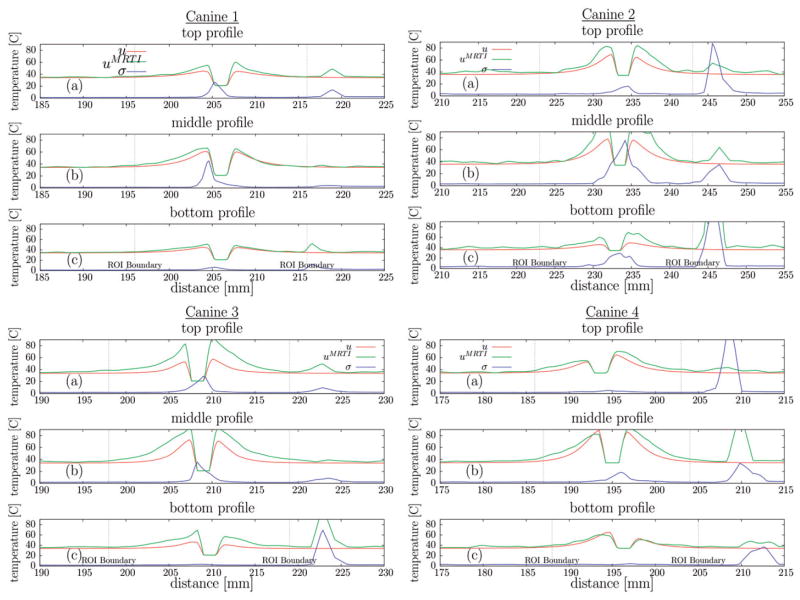
Figure 5.
Canine 1–4 spatial profiles summary, CDA, The (a) top, (b) middle, and (c) bottom profiles illustrated in Figures 3, 4(a) plot the maximum over time of the MR temperature data (°C), computational prediction (°C), and MR temperature noise (°C) against distance (mm). Profiles extend beyond the ROI used in normalisation in Figure 2; the boundary of the ROI is denoted on the profiles.

