
Fig. 3.
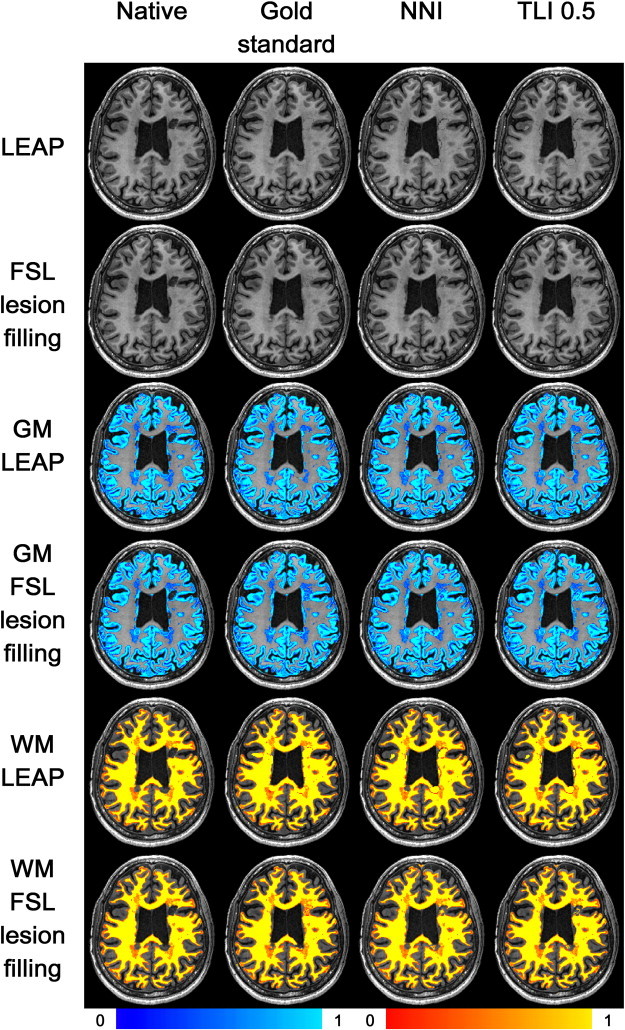
Images after lesion filling with LEAP (row 1) and FSL-lesion_filling (row 2). Rows 3 and 4: grey matter (GM) segmentation after lesion filling with LEAP (row 3) and FSL-lesion_filling (row 4). Rows 5 and 6: white matter (WM) segmentation after lesion filling with LEAP (row 5) and FSL-lesion_filling (row 6). From left to right: no lesion masks; image with precise manual lesion masks; image with nearest neighbor registered lesion masks; image with trilinearly registered lesion masks threshold = 0.5. The color scales are the same for all images and are depicted below.