
Figure 4. Sensitivity of rat and human L-FABP secondary structure to temperature induced unfolding.
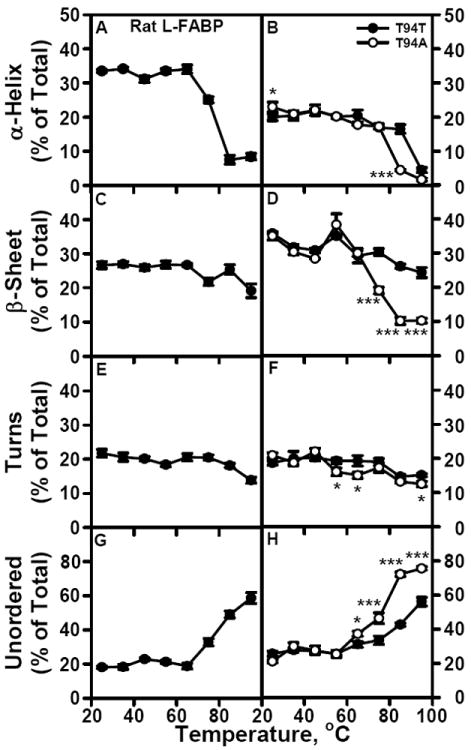
CD spectra and secondary structure analysis of rat and human L-FABPs were determined as a function of sample temperature as described in Methods. Panels A, C, E, and G show the amount of rat L-FABP total α-helix, total β-sheet, turn, and unordered secondary structure, respectively, as a percentage of the total secondary structure. Panels B, D, F. and H show the amount of human T94T WT L-FABP (●) or human T94A variant L-FABP (○) total α-helix, total β-sheet, turn, and unordered secondary structure, respectively, as a percentage of the total secondary structure. *, P < 0.05 for T94A vs T94T; ***, P < 0.001 for T94A vs T94T.