
Fig. 1.
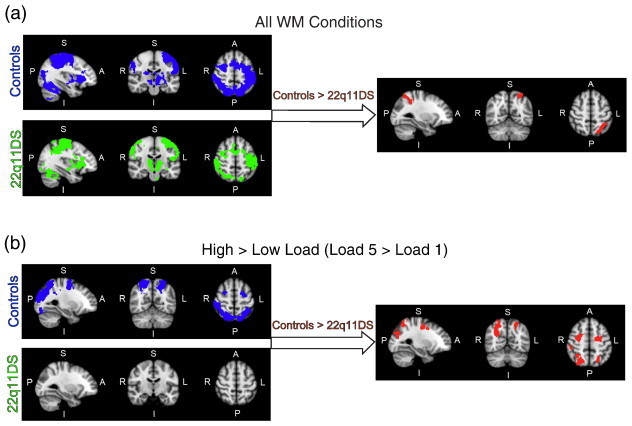
fMRI activity maps during performance on the spatial capacity working memory (SCAP) task. Blue maps represent neural activity in controls, green maps represent neural activity in 22q11DS patients, and red maps represent the between-group contrast of controls > 22q11DS patients. Brain orientations are labeled such that S = superior, I = inferior, P = posterior, and A = anterior; R = right and L = left. (a) Activation maps represent the contrast of all WM conditions combined (all loads and all delay length WM trials > Baseline), to investigate neural activity related to overall spatial WM performance. (b) Activation maps represent the contrast of high versus low WM load (Load 5 > Load 1), to investigate neural activity related to WM load. No regions showed significantly greater neural activity in 22q11DS vs. controls for these contrasts. (For interpretation of the references to color in this figure legend, the reader is referred to the web version of this article.)