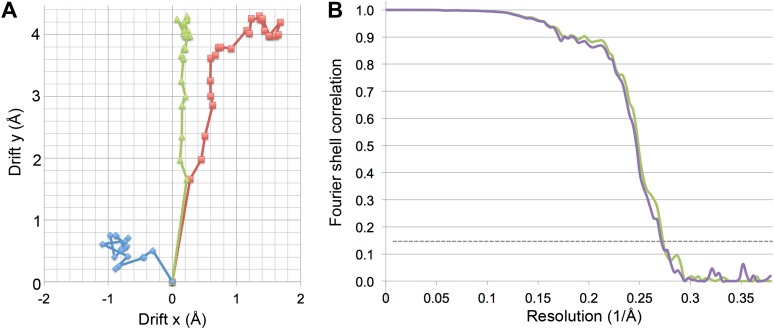
Figure 3. Specimen movement as detected by recording images in video mode.
The motion correction software indicates a large movement at the beginning of the exposure. (A) Video frame alignment for three separate micrographs. Each spot represents one frame. The drift plots show that the movement between the first and second frame is considerably higher than in subsequent frames, although some micrographs (red and green) indicate much higher drift than others (blue). (B) FSC curves of a refinement with and without the first video frame. The violet curve represents a refinement of frames 1–17, the green curve frames 2–17. Although at FSC 0.143 the resolution is the same for for both maps (3.69 Å), the green curve without the first frame clearly shows a higher FSC in the whole resolution range.

