. 2014 Feb 25;3:e01612. doi: 10.7554/eLife.01612

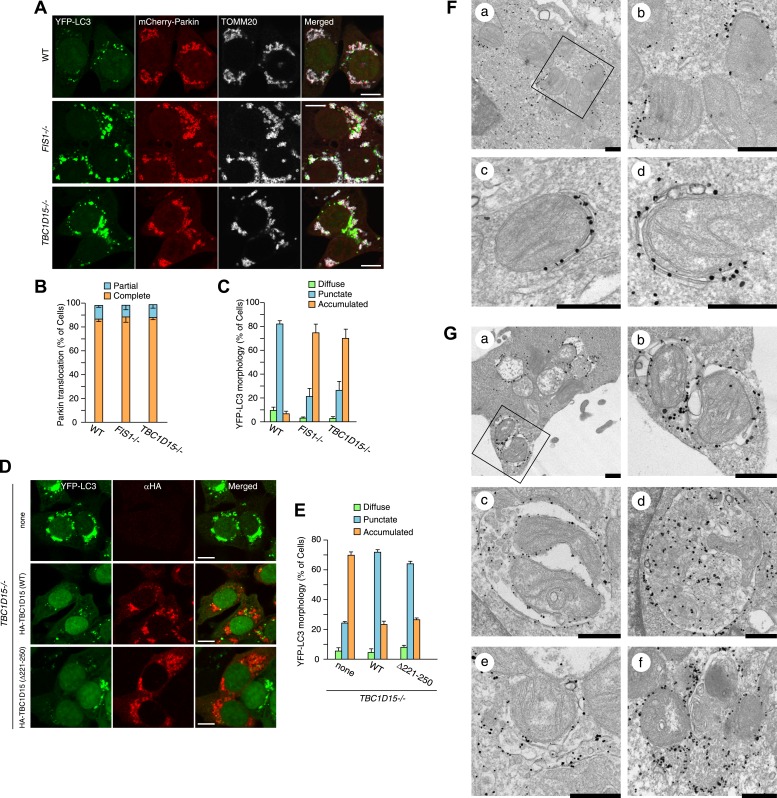
Figure 2. Loss of Fis1 or TBC1D15 causes LC3 accumulation during mitophagy.

(A) The indicated cell lines stably expressing YFP-LC3 and mCherry-Parkin were treated with valinomycin for 3 hr and subjected to confocal immunofluorescence microscopy with anti-TOMM20 antibody. Scale bars, 10 μm. (B) Quantification of mCherry-Parkin translocation to mitochondria after 3 hr of valinomycin treatment. Partial or complete translocation to mitochondria in each cell was scored as separate phenotypes. Partial and complete denote that Parkin translocates to some of or all mitochondria, respectively. The error bars represent ±SD from three independent experiments. Over 100 cells were counted in each of three separate wells. (C) YFP-LC3 morphologies in (A) were quantified. Percentages of cells harboring diffuse, punctate or accumulated YFP-LC3 are shown. The error bars represent ±SD from three independent replicates. Over 100 cells were counted in each replicate. For the criteria of LC3 morphology, see Figure 2—figure supplement 1. (D) YFP-LC3 and mCherry-Parkin stably expressing TBC1D15−/− cells in the absence or presence of HA-tagged TBC1D15 WT or Δ221-250 mutant were treated with valinomycin for 3 hr. Cells were subjected to immunofluorescence microscopy with anti-HA antibody. Scale bars, 10 μm. (E) The YFP-LC3 morphology of cells in (D) was quantified. The error bars represent ±SD from three independent replicates. Over 50 cells were counted in each well. (F and G) YFP-LC3 and mCherry-Parkin stably expressing WT (F) and TBC1D15−/− (G) cells were treated with valinomycin for 3 hr and then subjected to immunoelectron microscopy with anti-GFP antibody. The square in panel a shows enlarged areas in panel b Scale bars, 500 nm.

DOI: http://dx.doi.org/10.7554/eLife.01612.005

Figure 2.

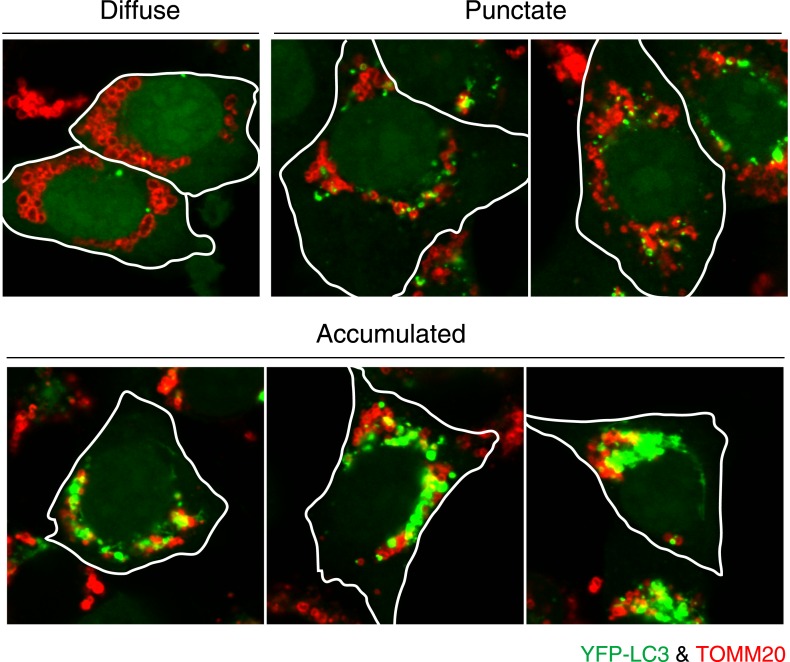
Figure 2—figure supplement 1. Image examples of different LC3 morphologies.

Figure 2—figure supplement 1.

HCT116 cells stably expressing YFP-LC3 (green) and mCherry-Parkin were treated with valinomycin for 3 hr and then subjected to immunostaining with anti-TOMM20 (red) antibody. Diffuse, YFP-LC3 distributes throughout the cytosol with few dots that are not on mitochondria; Punctate, many discrete YFP-LC3 dots, crescent-shaped, or circular signals on or near mitochondria; Accumulated, highly interconnected YFP-LC3 accumulation or large YFP-LC3 clumps on or near mitochondria.
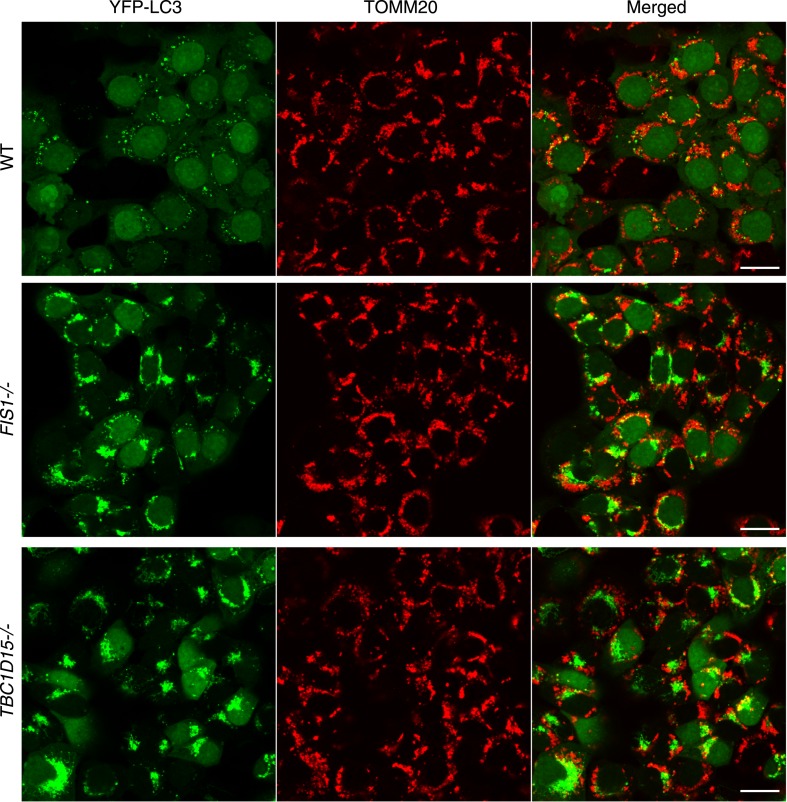
Figure 2—figure supplement 2. YFP-LC3 accumulation in FIS1−/− and TBC1D15−/− cells during mitophagy.

Figure 2—figure supplement 2.

Low magnification images of cells stably expressing YFP-LC3 and mCherry-Parkin treated with valinomycin for 3 hr. The cells were subjected to immunofluorescence microscopy with anti-TOMM20 antibody. Scale bars, 20 μm.
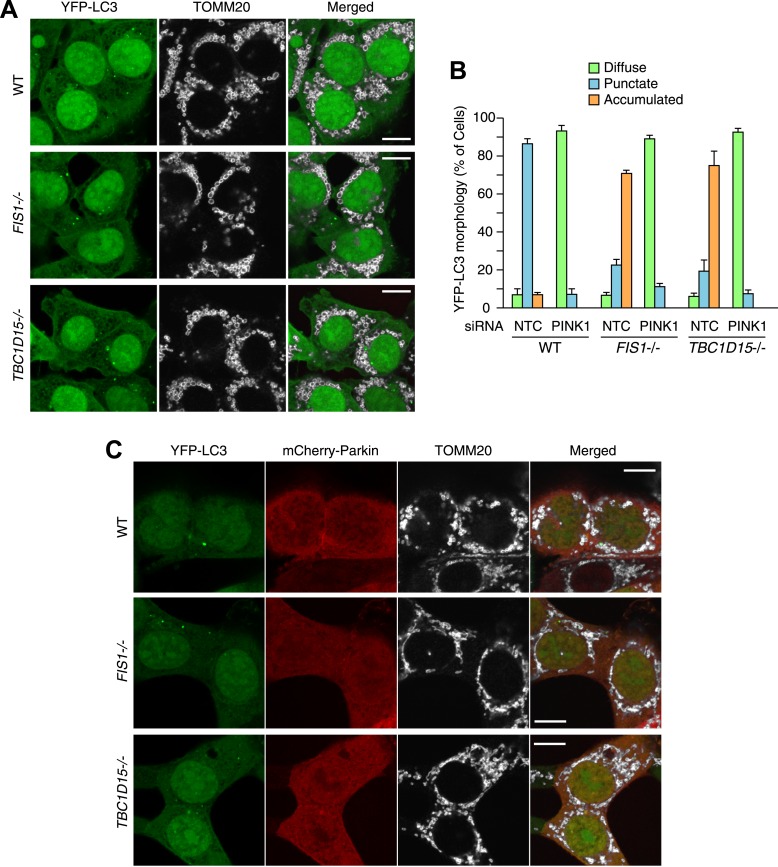
Figure 2—figure supplement 3. Excessive LC3 accumulation depends on PINK1/Parkin-mediated mitophagy.

Figure 2—figure supplement 3.

(A) The indicated HCT116 cells stably expressing YFP-LC3 (without mCherry-Parkin) were treated with valinomycin for 3 hr followed by immunofluorescence microscopy with anti-TOMM20 antibody. Scale bars, 10 μm. Of note, HCT116 cells do not express enough endogenous Parkin to induce mitophagy. (B) WT, FIS1−/− and TBC1D15−/− cells stably expressing YFP-LC3 and mCherry-Parkin were treated with control (NTC) or PINK1 siRNA. The percentages of cells harboring diffuse, punctate or accumulated YFP-LC3 after 3 hr of valinomycin treatment were quantified. The error bars represent ±SD from three independent replicates. Over 100 cells were counted in each of three replicates. (C) The indicated cells stably expressing YFP-LC3 and mCherry-Parkin without valinomycin treatment were subjected to immunofluorescence microscopy with anti-TOMM20 antibody. Scale bars, 10 μm.
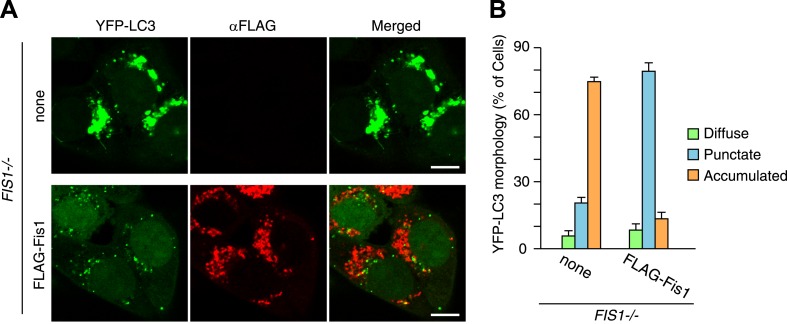
Figure 2—figure supplement 4. LC3 accumulation in FIS1−/− cells was rescued by Fis1 re-expression.

Figure 2—figure supplement 4.

(A) YFP-LC3 and mCherry-Parkin stably expressing FIS1−/− cells with or without 3xFLAG-Fis1 were treated with valinomycin for 3 hr. Cells were subjected to immunofluorescence microscopy with anti-FLAG antibody. (B) YFP-LC3 morphologies in cells in (A) were quantified. Percentages of cells harboring diffuse, punctate or accumulated YFP-LC3 are shown. The error bars represent ±SD from three independent replicates. Over 50 cells were counted in each replicate.
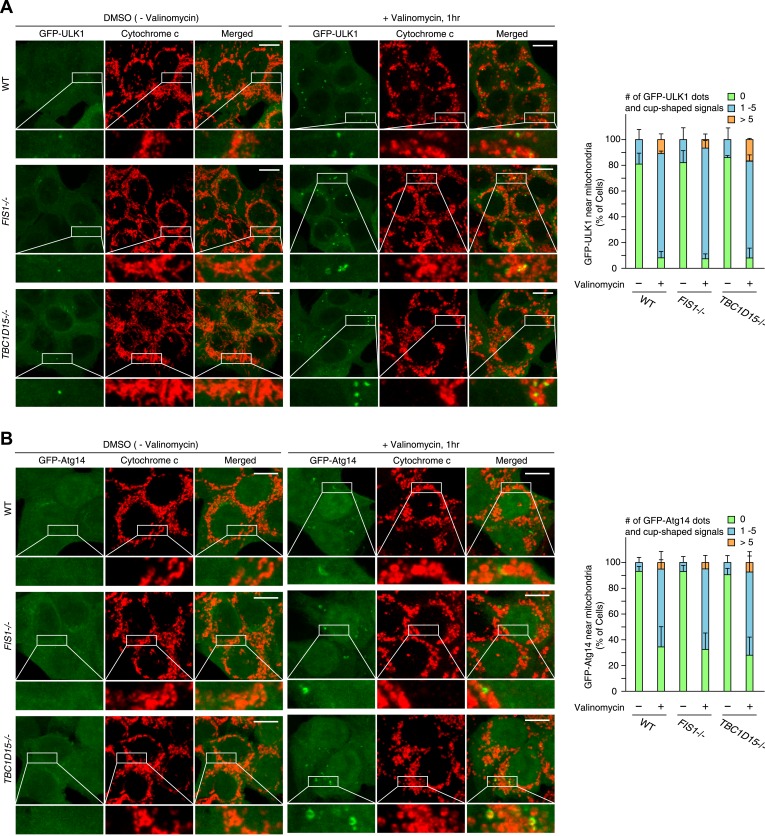
Figure 2—figure supplement 5. ULK1 and Atg14 recruitment in WT, FIS1−/− and TBC1D15−/− cells during mitophagy.

Figure 2—figure supplement 5.

The indicated cell lines stably expressing GFP-mouseULK1 (A) or GFP-Atg14 (B) and mCherry-Parkin were treated with or without valinomycin for 1 hr and subjected to immunofluorescence microscopy with anti-Cytochrome c antibody. Images are displayed as z-stacks of 6 confocal slices. Magnified images are also shown. Scale bars, 10 μm. The right graph shows the number of GFP-ULK1 or GFP-Atg14 dots and/or cup-shaped signals near mitochondria. The error bars represent ±SD from three replicates. Over 50 cells were counted in each well.
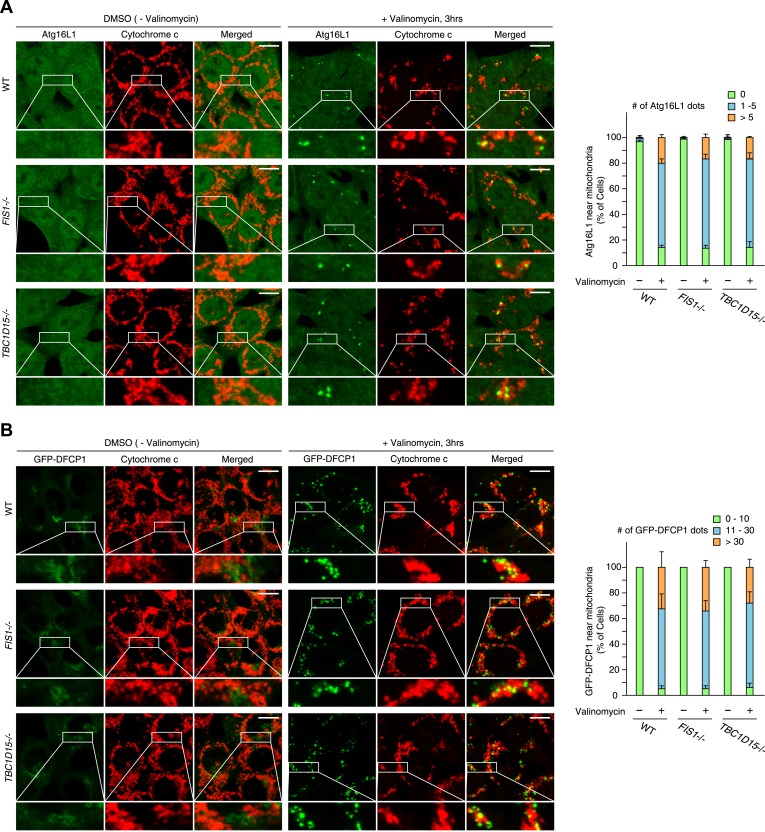
Figure 2—figure supplement 6. Atg16L1 and DFCP1 recruitment in WT, FIS1−/− and TBC1D15−/− cells during mitophagy.

Figure 2—figure supplement 6.

(A) The indicated cell lines stably expressing mCherry-Parkin were treated with or without valinomycin for 3 hr and subjected to immunofluorescence microscopy with anti-Atg16L1 and anti-Cytochrome c antibodies. (B) The indicated cell lines stably expressing GFP-mouseDFCP1 and mCherry-Parkin were treated with or without valinomycin for 3 hr and subjected to immunofluorescence microscopy with anti-Cytochrome c antibody. Images are displayed as z-stacks of 6 confocal slices. Magnified images are also shown. Scale bars, 10 μm. The right graph shows the number of Atg16L1 or GFP-DFCP1 dots near mitochondria. The error bars represent ±SD from three independent replicates. Over 50 cells were counted in each replicate.