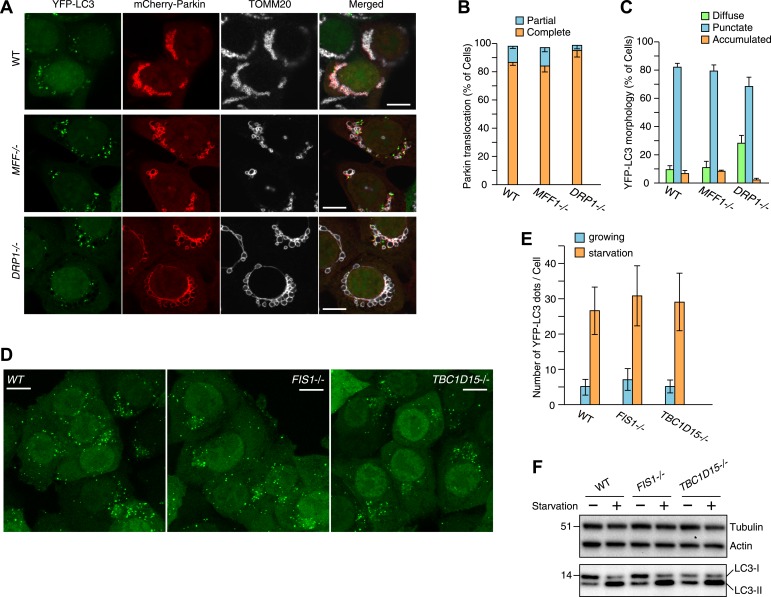
Figure 5. Effect of mitochondrial fission and starvation induction on LC3 accumulation in WT, FIS1−/− and TBC1D15−/− cells.
(A) WT, MFF−/− or DRP1−/− cells stably expressing YFP-LC3 and mCherry-Parkin were treated with valinomycin for 3 hr and subjected to immunofluorescence microscopy with anti-TOMM20 antibody. Scale bars, 10 μm. (B) Quantification of mCherry-Parkin translocation to mitochondria after 3 hr of valinomycin treatment. Partial and complete denote that Parkin translocates to some of and all mitochondria, respectively. The error bars represent ±SD from three independent replicates. Over 50 cells were counted in each replicate. (C) YFP-LC3 morphologies of cells in (A) were quantified. Percentages of cells harboring diffuse, punctate or accumulated YFP-LC3 are shown. The error bars represent ±SD from three independent replicates. Over 100 cells were counted in each replicate. (D) WT, FIS1−/−, and TBC1D15−/− cells stably expressing YFP-LC3 were grown in starvation media. Z-stacks of confocal images are shown. Scale bars, 20 μm. (E) The number of YFP-LC3 dots in cells under growth or starvation conditions was quantified. The error bars represent ±SD from three independent replicates. Over 50 cells were counted in each well. (F) Total cell lysates from cells grown in normal or starvation media for 6 hr were subjected to immunoblotting. LC3-I and LC3-II denote cytosolic and lipidated LC3B, respectively.

