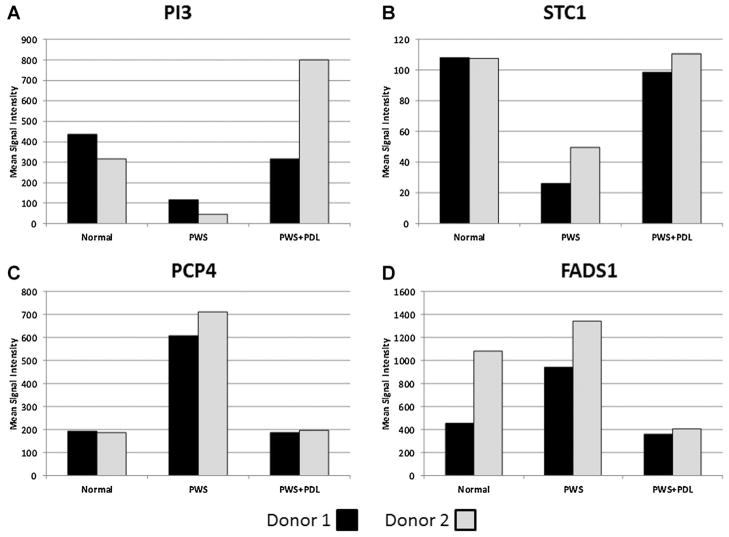
Fig. 1.
Expression profiles of genes exhibiting co-ordinate expression profiles between PWS and laser treated lesions. Affymetrix GeneChip data are shown as normalized average intensity values for each gene in pairs of subjects as follows: (A) Peptidase Inhibitor 3, Skin-Derived (PI3), (B) Stanniocalcin 1 (STC1), (C) Purkinje Cell Protein 4 (PCP4), (D) Fatty Acid Desaturase 1 (FADS1). Panels A–C; subjects 1 (black bar) and 2 (gray bar), panel D; subjects 2 (black bar) and 4 (gray bar).

