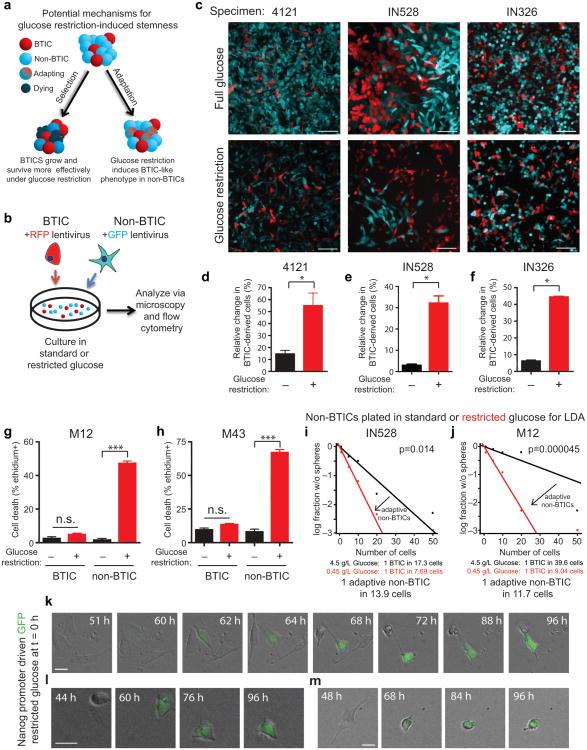
Figure 2. Enrichment for Brain Tumor Initiating Cells (BTICs) Under Nutrient Deprivation is Associated with Preferential BTIC survival and Adaptation of non-BTICs Towards a BTIC Phenotype.
(a) Schematic of potential mechanisms for glucose restriction induced BTIC enrichment shows the potential for low glucose to select for surviving BTICs or for non-BTICs to adapt to nutrient restriction through acquisition of BTIC-like phenotypes. (b) Strategy for competition experiments with fluorescently labeled BTICs and non-BTICs. (c) Fluorescently labeled BTICs and non-BTICs were plated at defined numbers via flow cytometry and the percentage of cells derived from them monitored over time in standard (4.5 g/L) or restricted glucose (0.45 g/L). Scale bars represent 75 μm. Representative images of cells after 7 days are shown. Flow cytometry was used to quantify the percentage of BTIC and non-BTIC cells from (d) 4121 [*, p=0.0211 with unpaired t-test], (e) IN528 [*, p<0.02 with unpaired t-test], or (f) IN326 [*, p<0.0005 with unpaired t-test] specimens in standard and low glucose and the relative change in the percentage of BTIC-derived cells is shown. Ethidium homodimer III staining demonstrated elevated cell death in non-BTICs derived from (g) M12 [*, p=0.0011 with unpaired t-test] or (h) M43 [*, p<0.001 with unpaired t-test] GBMs after nutrient restriction. In vitro limiting dilution assays in which non-BTICs from (i) IN528 [p=0.014 with ELDA analysis] or (j) M12 [p=0.000045 with ELDA analysis] were plated directly into normal or low glucose demonstrated adaptation to nutrient restriction through promotion of a BTIC phenotype. (k-m) Time lapse imaging using reporter cells in which the Nanog promoter is driving GFP demonstrated that Nanog/GFP- cells can begin expressing Nanog/GFP after 60 hours of nutrient restriction. Three different panels of time lapse images for individual cells which became GFP+ are shown. Scale bars represent 25 μm.

