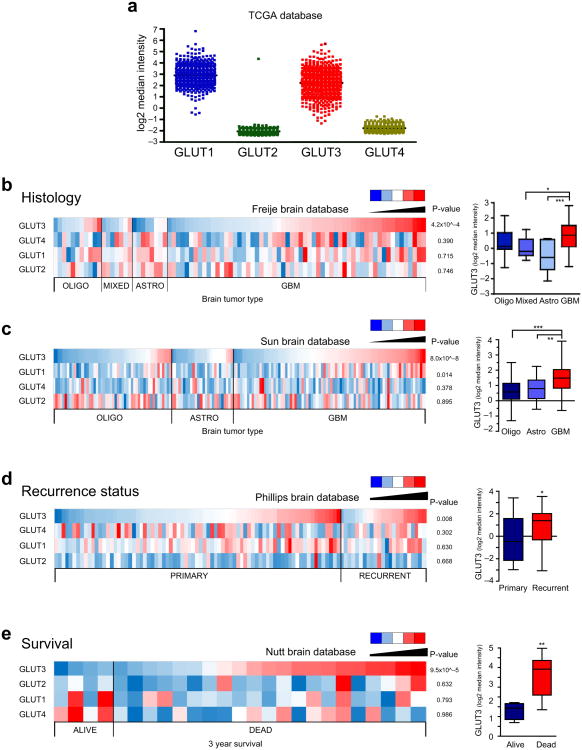
Figure 6. Glut3 Expression is Significantly Increased in Glioblastomas, Recurrent Brain Tumors, and Brain Tumors from Patients with Poor Survival.
(a) Expression of Glut isoforms in the TCGA database demonstrates expression of both Glut1 and Glut3 with minimal expression of Glut2 and Glut4. (b) Oncomine analysis of the Freije database indicates elevated Glut3 mRNA expression (but not Glut1, 2, or 4) correlates with increased glioma tumor grade [n=11 oliogodendroglioma; n=7 mixed glioma; n=8 astrocytomas; n=59 GBM; p=4.2×10ˆ−4 with ANOVA]. (c) Oncomine analysis of the Sun database indicates elevated Glut3 mRNA expression correlates with increased glioma tumor grade [n=50 oligodendroglioma; n=26 astrocytoma; n=81 GBM; p=8.02×10ˆ−8 with ANOVA]. There is also a significant correlation with Glut1 mRNA expression [p=0.014] but not Glut2 or Glut4. (d) Oncomine analysis of the Phillips databases indicates elevated Glut3 mRNA expression (but not Glut1, 2, or 4) correlates with glioma recurrence [n=77 primary; n=23 recurrent; p=0.008 with unpaired t-test]. (e) Oncomine analysis of the Nutt database indicates elevated Glut3 mRNA expression (but not Glut1, 2, or 4) correlates with reduced patient survival at three years [n=4 alive; n=21 dead; p=9.5×10ˆ−5 with unpaired t-test].

