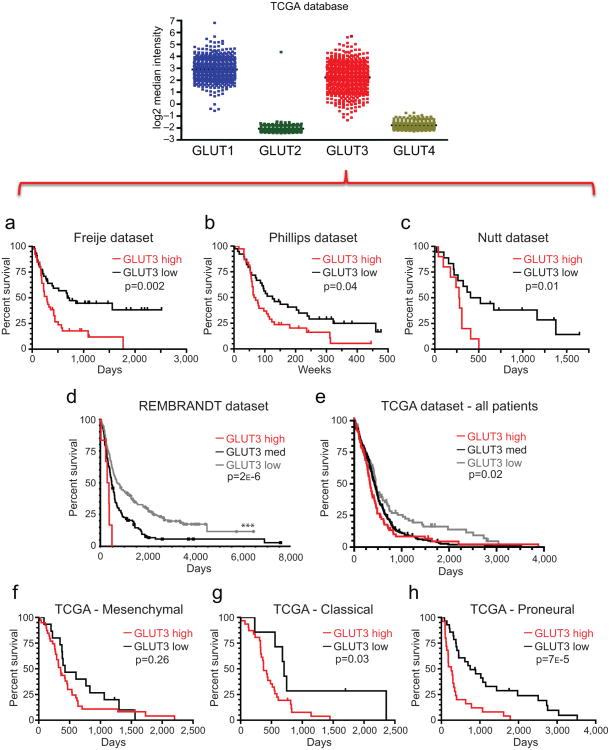
Figure 7. Glut3 Expression Correlates with Poor Survival in Multiple Brain Tumor Datasets.
Analysis of Brain Datasets available through Oncomine indicates a significant correlation between high Glut3 expression and poor survival in the (a) Freije [n=39 Glut3 low; n=45 Glut3 high; p=0.002 with log-rank analysis], (b) Phillips [n=39 Glut3 low; n=38 Glut3 high; p=0.04 with log-rank analysis], and (c) Nutt [n=18 Glut3 low; n=10 Glut3 high; p=0.01 with log-rank analysis] datasets. (d) Analysis of REMBRANDT data in the National Cancer Institute's repository indicates that greater than two fold elevation of Glut3 mRNA expression correlates with poor glioma patient survival [n=193 Glut3 low; n=144 Glut3 medium; n=6 Glut3 high; p=0.002 vs. all other samples and p=0.018 vs. intermediate expression with log-rank analysis]. Greater than two fold reduction in Glut3 mRNA expression correlates with improved patient survival [**, p=2.2×10⁻⁶ vs. all other samples and p=7.7×10⁻⁶ vs. intermediate expression with log rank analysis]. Reporter is Affymetrix 202499_s_at (Highest Geometric Mean Intensity). (e) Analysis of TCGA data indicates a significant correlation between reduced Glut3 expression and survival in all patients [n=103 Glut3 low; n=320 Glut3 medium; n=91 Glut3 high; *, p=0.02 with log-rank analysis]. Classification of TCGA according to Verhaak subtypes indicates Glut3 does not significantly correlate with survival in (f) Mesenchymal tumors [n=15 Glut3 low; n=39 Glut3 high; p=0.26 with log-rank analysis], but reduced Glut3 correlates with improved patient survival in both (g) Classical [n=7 Glut3 low; n=31 Glut3 high; p=0.03 with log-rank analysis] and (h) Proneural [n=28 Glut3 low; n=25 Glut3 high; p=7×10⁻⁵ with log rank analysis] GBM subtypes.

