Figure 2.

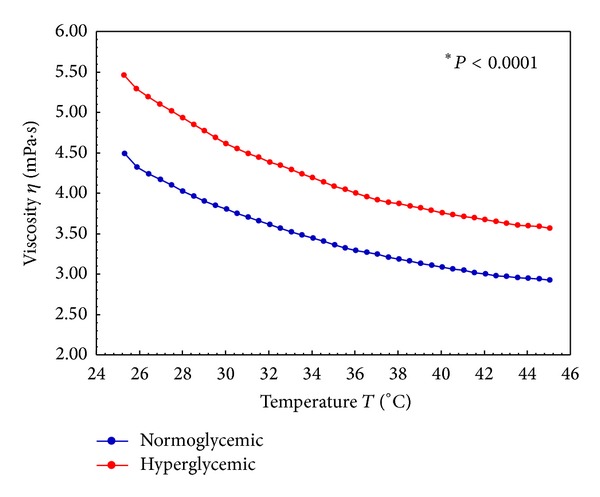
Viscosity curve of normoglycemic and hyperglycemic whole blood under a temperature scan (25 at 45°C). *Statistical difference (P < 0.05).

Viscosity curve of normoglycemic and hyperglycemic whole blood under a temperature scan (25 at 45°C). *Statistical difference (P < 0.05).