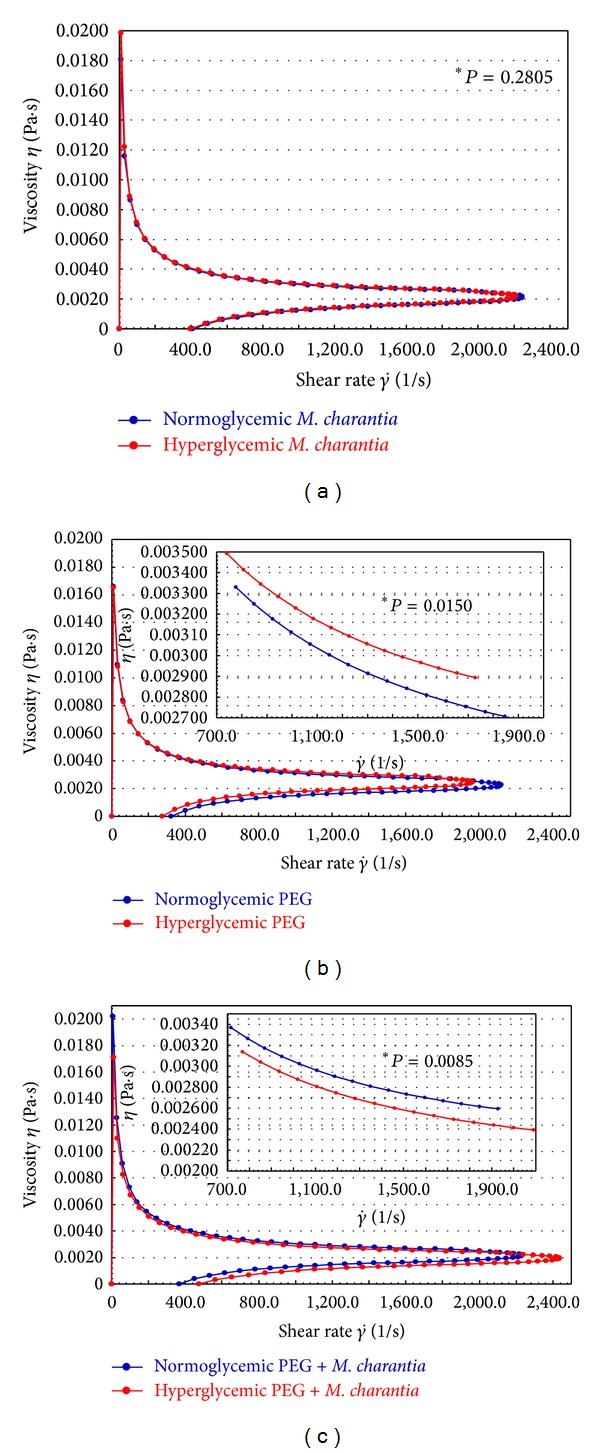
Figure 4.

Viscosity curves of normoglycemic and hyperglycemic whole blood after treatment. (a) Treatment with M. charantia L. (b) Treatment with PEG microspheres. (c) Treatment with PEG microspheres adsorbed with M. charantia L. *Amplification of the region with a statistical difference (P < 0.05).
