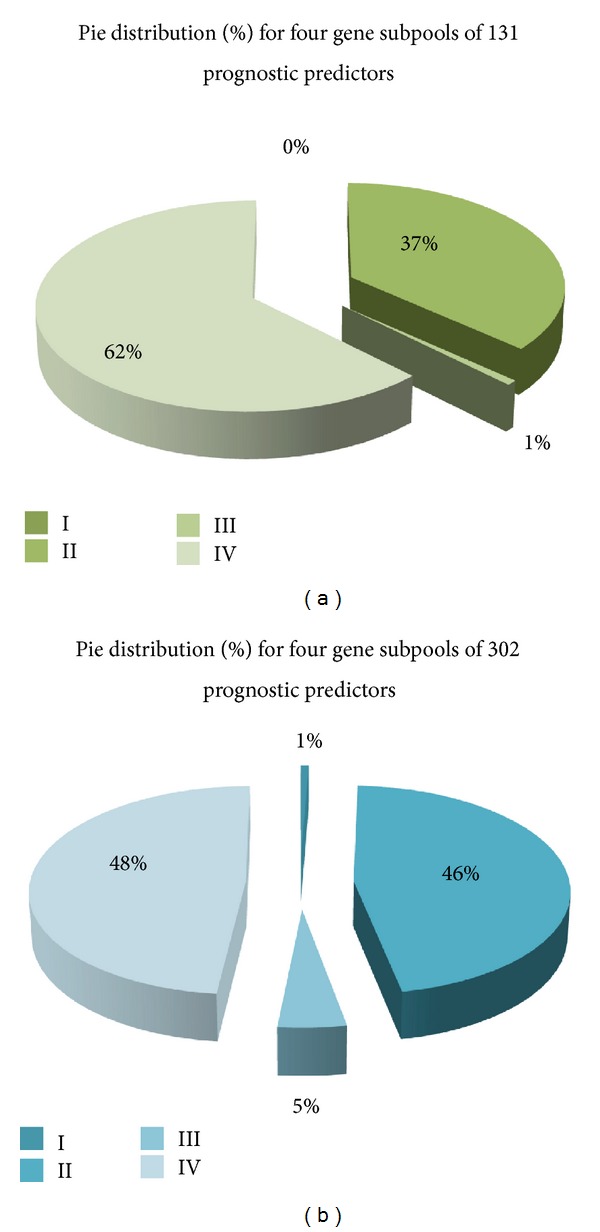
Figure 5.

The pie chart for feature distribution of prognostic relevant genes in the network of MYB_ARNT2. First, two networks of MYB_ARNT2 with cohort relevance (90A cohort and 181A cohort) identify 131 probes and 302 probes to be the potential prognostic factors in 90A cohort and 181A cohort, respectively. Second, the pie distribution made for four classified prognostic predictor subpools derived from overlapping between the cohort network of MYB_ARNT2 and four types of prognostic indicators in three selected populations (91A cohort, 90A cohort, and 181A cohort), respectively. The pie chart demonstrates the sizes of four gene subpools for the given gene pool by its corresponding percentage to be distributed in a pie. The common trend shared by two pie charts is that size of gene subpools in four feature types followed an order of type IV > type II > type III > type I.
