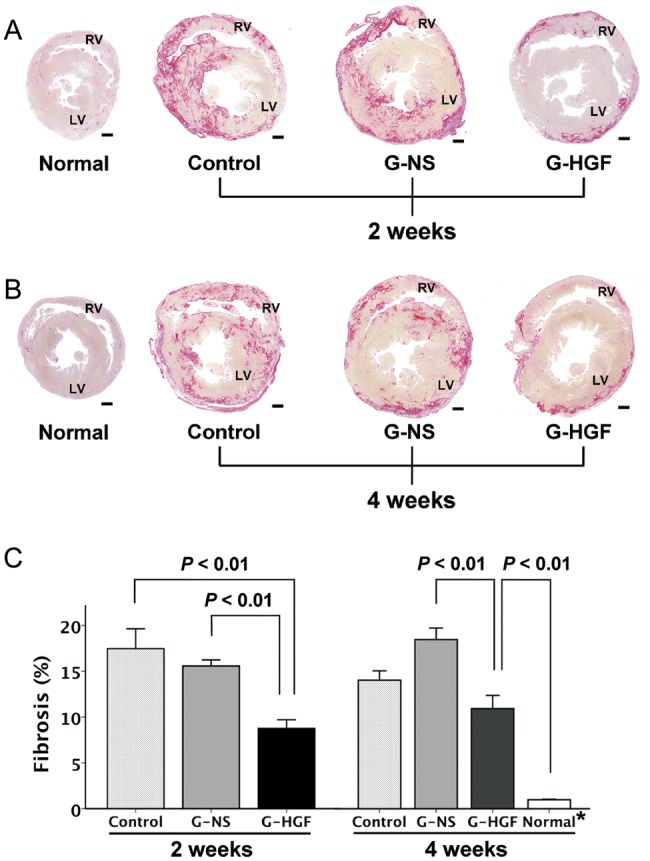
Figure 3:

(A) Sirius-red-stained sections at 2 weeks after treatment. (B) Sirius-red-stained sections at 4 weeks after treatment. (C) Quantitative analysis of fibrotic area as a percentage. Bars = 1 mm. All values are expressed as means ± SEM. G-HGF: gelatin-hepatocyte growth factor; G-NS: gelatin-normal saline; LV: left ventricle; RV: right ventricle.
