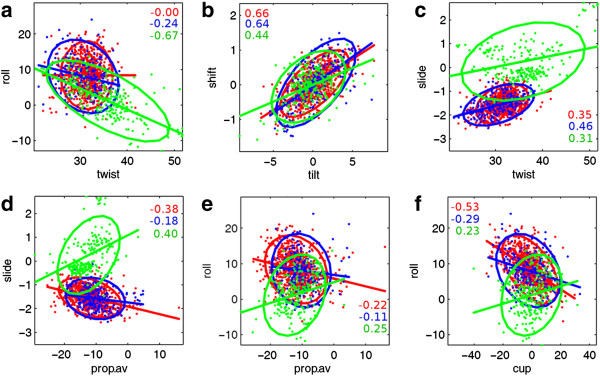
Figure 1.
Correlation between dinucleotide step parameters for Watson-Crick basepair containing steps in RNA and DNA helices. The dinucleotide step parameters in each dataset are plotted along with a Mahalanobis ellipse that is fitted with the mean as centre. Correlation coefficient (r) value and best-fit line for each group are also shown. The data are colour coded as red: free-RNA, blue: ADNA, green: BDNA. For the sake of clarity, bound-RNA dataset is not included here, but shows similar trends as free-RNA. Prop.av: corresponds to average propeller-twist of both basepairs constituting a step. Correlations between a few selected parameters are shown here (a-f). See Additional file 1 for the complete data on correlation between all parameters.

