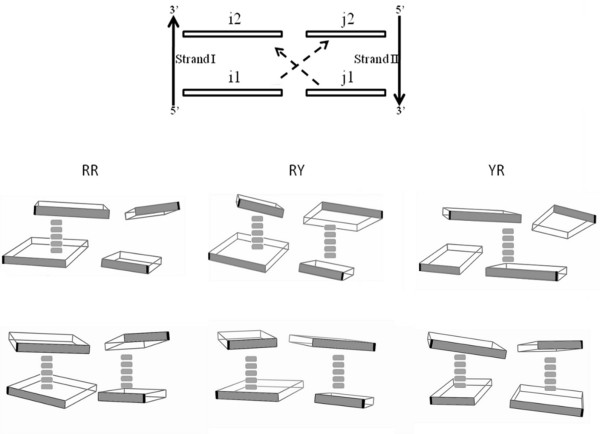
Figure 4.
Schematic diagrams showing the nomenclature used and block diagrams illustrating the major base overlaps in A-RNA and BDNA. The mutual overlap between bases i1-i2 and j1-j2 represent intra-strand overlap, while that between i1-j2 and j1-i2 correspond to cross-strand overlap. The blocks are drawn with the minor groove facing edge of each base shaded grey and the large blocks representing purines. The glycosidic bond attachment point is marked in black. The distinct stacking pattern of bases in RR, RY and YR steps is shown for RNA (Row 1) and BDNA (Row 2). A thick dashed line is drawn connecting the bases that show significant overlap. The base coordinates are taken from representative crystal structures (PDB_ID: 1RNA and 1BNA) and block diagrams drawn using 3DNA program [42].

