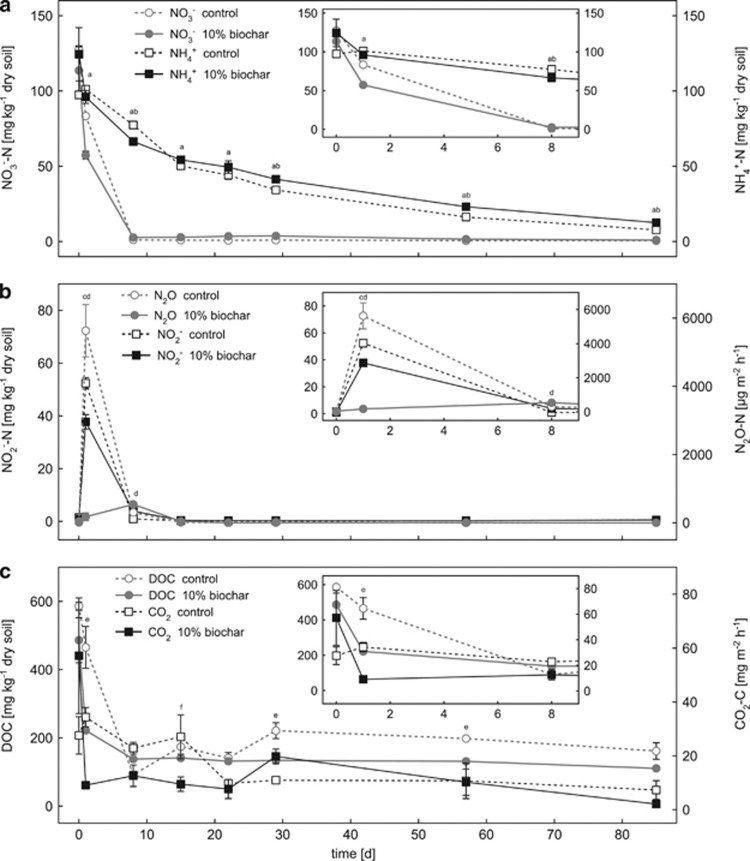
Figure 1.
Change in nitrogen (a, b) and carbon (c) geochemical parameters in the control and 10% (w/w) biochar-containing soil microcosms over time. Panels a, b show changes in the concentrations of nitrate, nitrite, ammonium and nitrous oxide, whereas panel c shows the DOC and carbon dioxide data. The small inserted graphs show a magnified view of the data for the first 8 days. Open symbols with dashed lines represent data of the control microcosms without biochar. Filled symbols with solid lines represent data of the soil microcosms with 10% (w/w) biochar. Statistically significant differences (univariate ANOVA, post hoc: least significant difference) between control and 10% (w/w) biochar microcosms at a certain time point are indicated by lower-case letters above the individual data points (a=NO3−, b=NH4+, c=N2O, d=NO2−, e=DOC, f=CO2).

