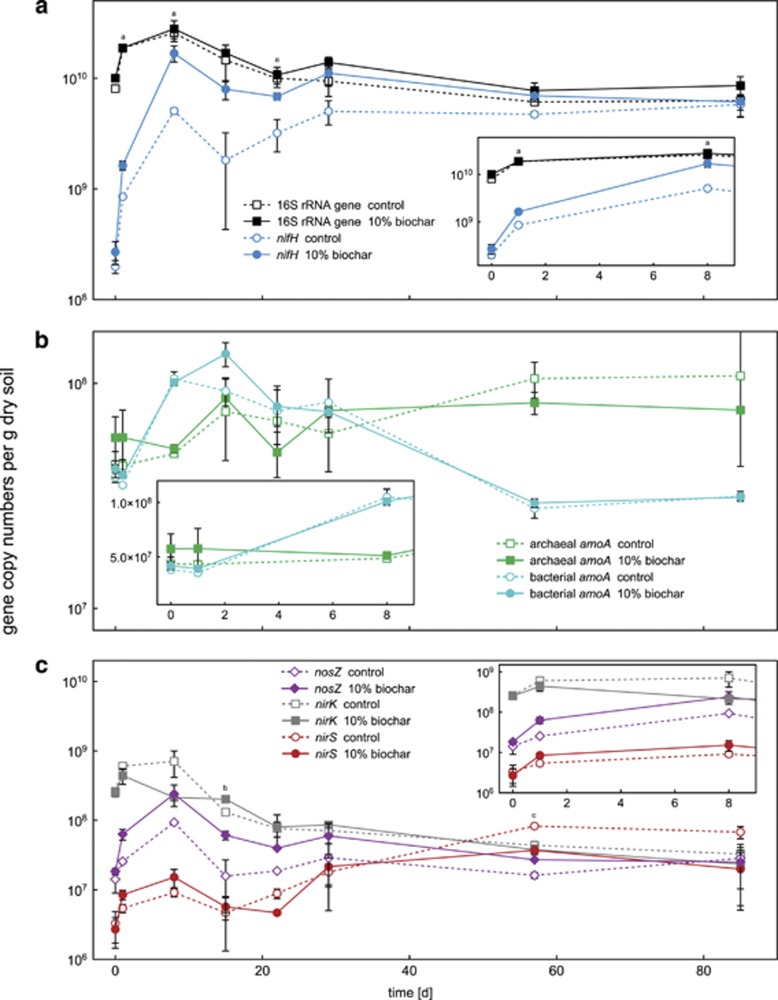
Figure 2.
Gene copy numbers per gram dry soil over time for various key genes of microbial nitrogen transformation processes in the control and 10% (w/w) biochar-containing microcosms. Panel a shows changes in total bacterial 16S rRNA and nifH gene copy numbers. In panel b, archaeal and bacterial amoA gene copy numbers are shown. Panel c summarizes the gene copy data for nirS, nirK and nosZ. The small inserted graphs show a magnified view of the data for the first 8 days. Note that the y axes of the inserted graphs in panels a, b and c have a slightly different scale from the corresponding overview graphs. Open symbols with dashed lines represent data measured in the control microcosms without biochar. Filled symbols with solid lines represent data of the soil microcosms with 10% (w/w) biochar. Statistically significant differences (univariate ANOVA, post hoc: least significant difference) between control and 10% (w/w) biochar microcosms at a certain time point are indicated by lower-case letters above the individual data points (a=nifH, b=nosZ and c=nirS).

