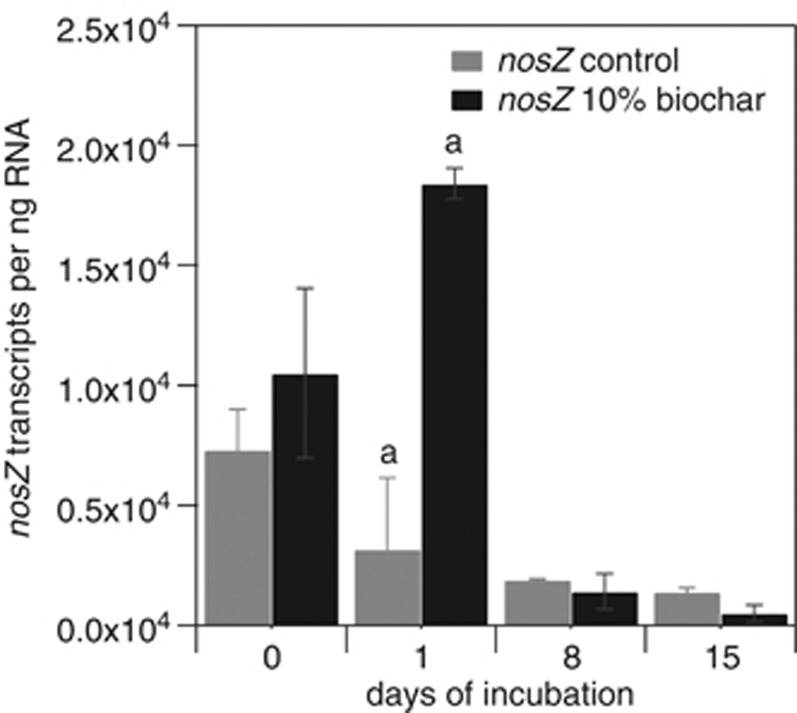
Figure 4.
nosZ transcript copy numbers per ng RNA in the control microcosms and in the soil microcosms with 10% (w/w) biochar during the initial 15 days of incubation. Gray bars represent data measured in the control microcosms without biochar. Black bars represent data of the soil microcosms with 10% (w/w) biochar. Statistically significant differences between 10% (w/w) biochar-containing and control microcosms are indicated by the letter ‘a' above the respective time points.

