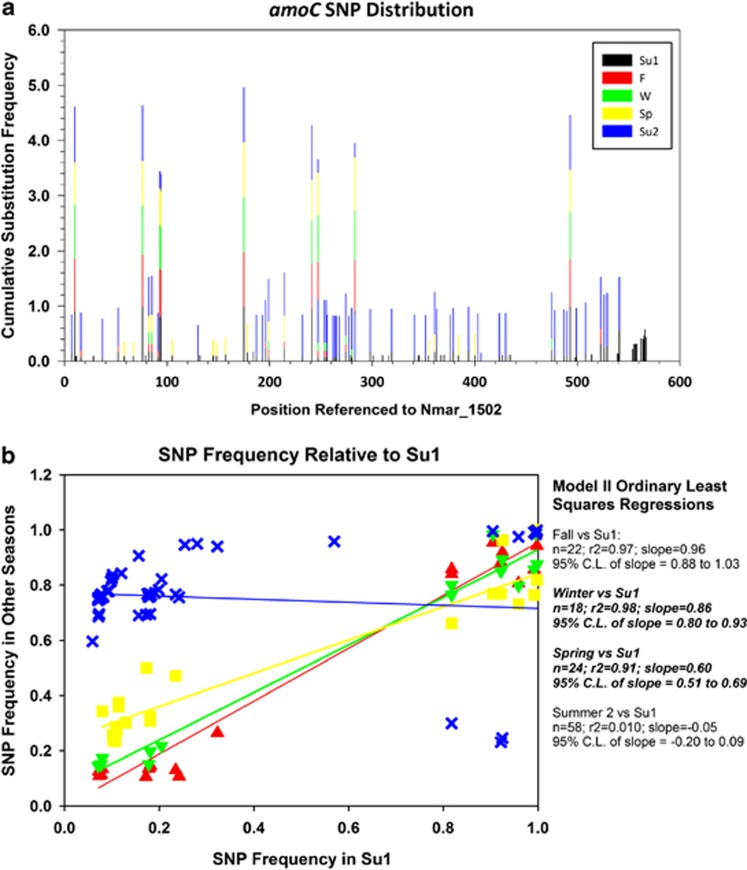
Figure 6.
Comparison of SNP distributions in assemblies of sequences from amoC transcripts in libraries collected quarterly from August 2008 to August 2009. Panel a represents the frequency of substitution at SNP sites referenced to positions on the Nmar_1502 sequence, calculated by season (stacked bar for clarity so the ordinate scale gives the sum of substitution frequencies for all seasons, color key applies to both panels). Panel b compares the frequency of substitutions at SNP sites in Summer 1 with the frequency of substitutions at those sites in other seasons. Parameters of Model II ordinary least-squares regressions of the seasonal data are shown at the right of the graph.

