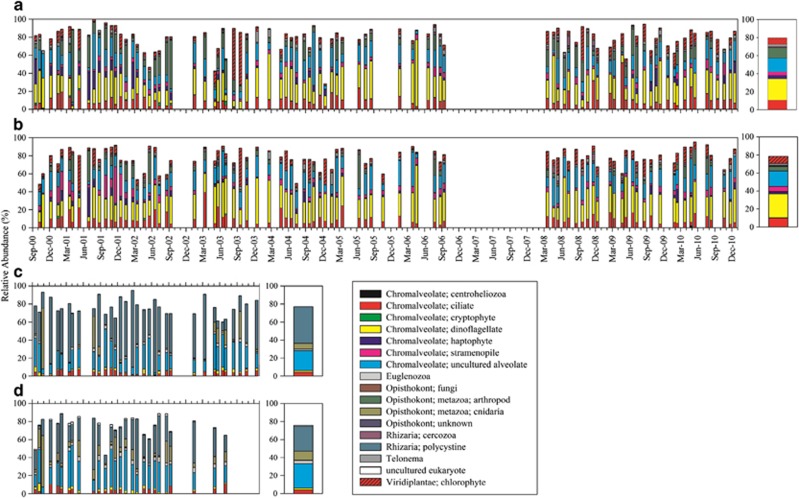
Figure 3.
Relative abundances of high-level taxonomic groups based on T-RFLP data for approximately monthly samples collected from 5 m (a) and the DCM (b) between 2000 and 2010 (with the exception of months between October 2006 and February 2008); and from 150 m (c) and 500 m (d) between 2000 and 2003 at the SPOT station. Gaps represent missing data. The averages of relative abundances for each high-level taxonomic group are presented on the right panel for each depth. Taxonomic identifications for the fragments were assigned using a database of 1341 18S rRNA gene sequences with assigned taxonomies that were subjected to in silico restriction digestion to predict the length of terminally labeled fragments at the study site (obtained from Kim et al., 2012). Monthly averages of the relative abundances of high-level taxonomic group are summarized for each depth in Supplementary Figure S3.

