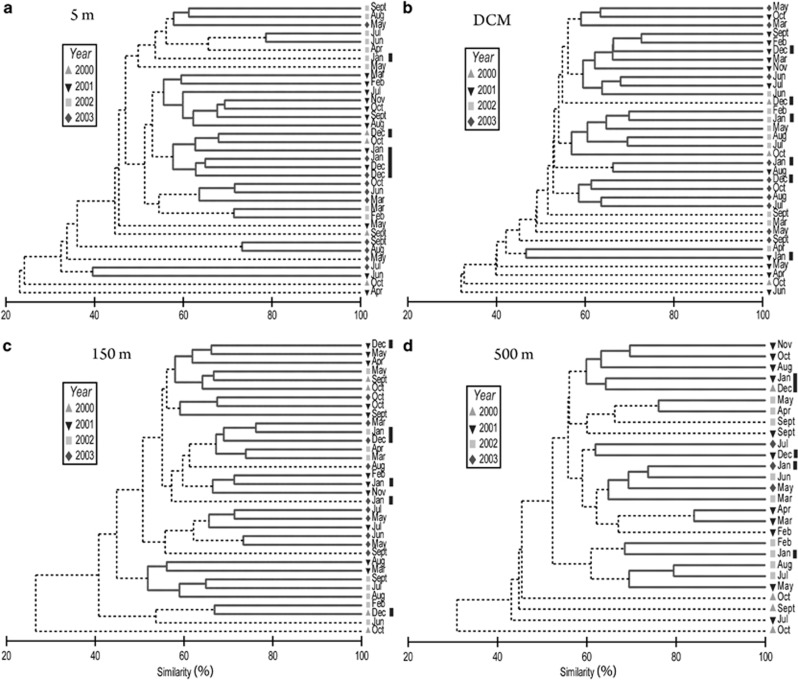
Figure 7.
CLUSTER results for assemblages collected approximately every month between September 2000 and December 2003 from 5 m (a), the DCM (b), 150 m (c) and 500 m (d), based on Bray–Curtis similarity values on square-root transformed T-RFLP data. Bray–Curtis similarity values (%) are on the x-axes and normalized. Solid lines denote differences that were not significant (P>0.05), and dotted lines denote significant differences (determined by SIMPROF). December and January samples are marked by bars to the right of each CLUSTER diagram.

