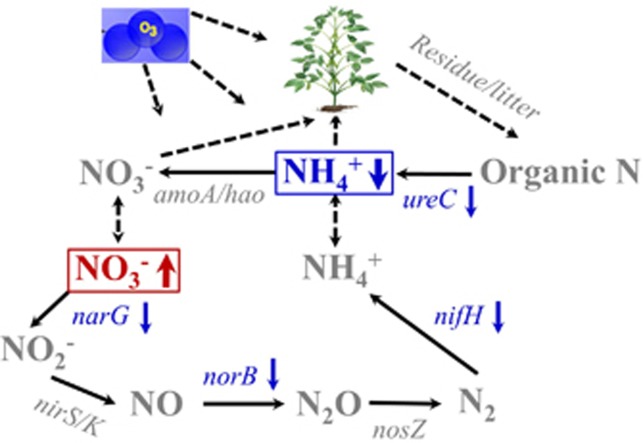
Figure 5.
A conceptual model for microbial N cycling in response to eO3. Red color indicates an increase in NO3− in the subsoil; blue color indicates decreases in NH4+ in the surface soil or abundances of N cycling genes; gray indicates those parameters were not measured or were not changed under eO3.

