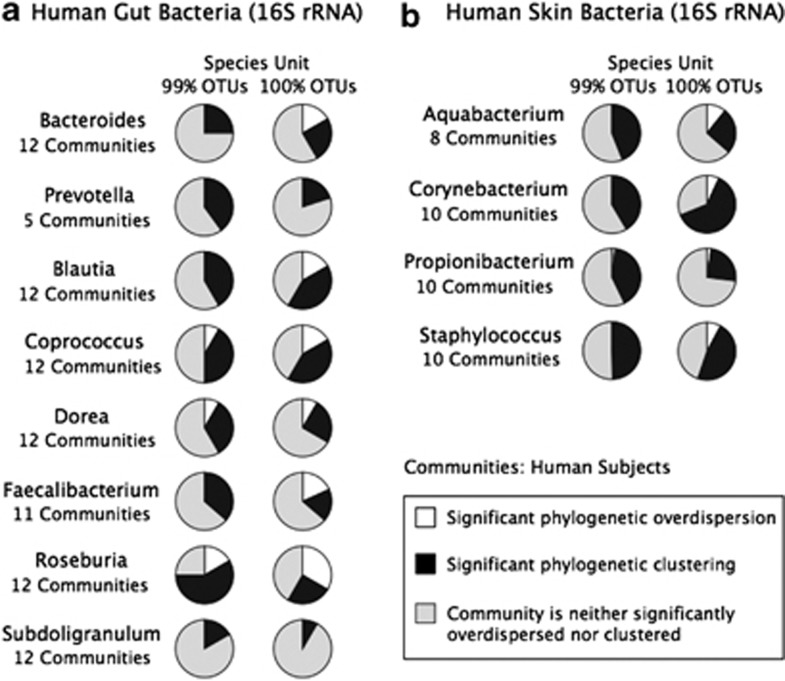
Figure 4.
Phylocom analysis of additional datasets. Phylocom results for all genera analyzed from the 16S rRNA sequences of the gut microbiome dataset (a), the skin microbiome dataset (b). Only NRI results are displayed. For simplicity, the skin microbiome pie charts displayed the Phylocom results averaged over all 21 skin sites.

